Biology 5090/21 — May/June 2011
Cambridge O-Level · Theory · worked solutions for every part, with the mark scheme
Topics Organisms and Their Environment · Plant Nutrition · Human Nutrition · Transport in Flowering Plants · Sexual Reproduction in Humans · Cell Division and Reproduction · +7 more
Fig. 1.1 shows how, in 1951, some compounds of mercury (an inorganic substance) entered and passed along a food chain.
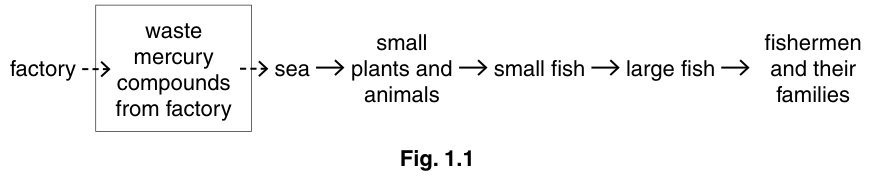
Name a producer in Fig. 1.1.
______
Table 1.2 shows the concentration of mercury in parts per billion (ppb) in unpolluted sea water, in polluted seawater, in the flesh of the small fish and in the flesh of the large fish.
Table 1.2
| unpolluted seawater / ppb | polluted seawater / ppb | flesh of small fish / ppb | flesh of large fish / ppb |
|---|---|---|---|
| 0.1 | 2.0 | 200 | 20 000 |
Calculate how many times more concentrated the mercury is in the polluted seawater than in the unpolluted seawater.
______
Explain why the concentration of mercury changed with each successive member of the food chain.
Suggest why many of the fishermen and their families suffered from mental illness.
The rest of this paper
8 more questions- Q2Transport in Flowering Plants · Plant Nutrition11M
- Q3Sexual Reproduction in Humans · Cell Division and Reproduction · Inheritance · Human Nutrition11M
- Q4Sexual Reproduction in Plants11M
- Q5Human Nutrition8M
- Q6Transport in Humans · Excretion10M
- Q7Organisms and Their Environment · Plant Nutrition10M
- Q8Cell Structure and Organisation · Movement Into and Out of Cells10M
- Q9Coordination and Control10M