Biology 5090/31 — October/November 2010
Cambridge O-Level · Practical Test · worked solutions for every part, with the mark scheme
Topics Experimental Contexts · Planning Experiments and Investigations · Observations and Measurements · Analysis, Conclusions and Evaluation · Microscopy and Biological Drawing · Use of Techniques, Apparatus and Materials
Read the whole of the question paper before you begin.
Set up the investigation in Question 1 then go on to Question 2 while you are waiting. Leave at least 15 minutes to complete Question 1 before the end of the examination.
You are required to investigate the effect of three different concentrations of a solution on strips of potato tissue.
- Remove the potato tissue from the solution and blot it gently with the paper towel to remove excess liquid.
- Cut six strips of potato exactly long by approximately wide.
- Label three dishes A, B and C, then place two potato strips in each.
- Add solutions A, B and C to the appropriate labelled dish, ensuring that the potato strips in each dish are covered by the solution.
- Note, in Table 1.1, the time when the solutions were added.
Leave at least 30 minutes before returning to complete this question.
Carry on with Question 2 while you wait.
Then:
- Remove the strips from solution A, blot them gently.
- Note the time in Table 1.1.
- Measure their lengths and record them in Table 1.1.
- Repeat this procedure for the strips in B and C.
Suggest why two strips were used, rather than one, in each solution.
______
Explain how your observations do, or do not, support this suggestion.
______
Complete Table 1.1.
Table 1.1
| solution | concentration / | time solution added | initial lengths / | mean length / | time removed from solution | final lengths / | mean length / | change in length / |
|---|---|---|---|---|---|---|---|---|
| A | 0.8 | 70 and 70 | 70 | and | ||||
| B | 0.4 | 70 and 70 | 70 | and | ||||
| C | 0.1 | 70 and 70 | 70 | and |
Using the information in Table 1.1 draw a graph, on the axes provided, of mean change in length against concentration of solution.
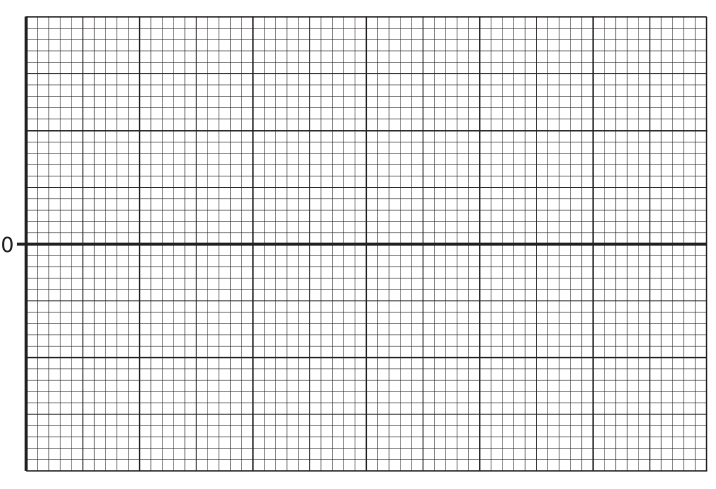
From your graph, determine the concentration of the solution at which there would be no change in mean length of potato strip.
______
Explain the significance of this concentration.
______
Suggest three ways in which this investigation could be improved.
- ______
- ______
- ______
The rest of this paper
1 more questions- Q2Microscopy and Biological Drawing · Experimental Contexts · Use of Techniques, Apparatus and Materials20M