Biology 5090/61 — May/June 2010
Cambridge O-Level · Alternative to Practical · worked solutions for every part, with the mark scheme
Topics Experimental Contexts · Analysis, Conclusions and Evaluation · Microscopy and Biological Drawing · Use of Techniques, Apparatus and Materials · Planning Experiments and Investigations · Observations and Measurements
Fruits of banana, Musa spp., change as they ripen.
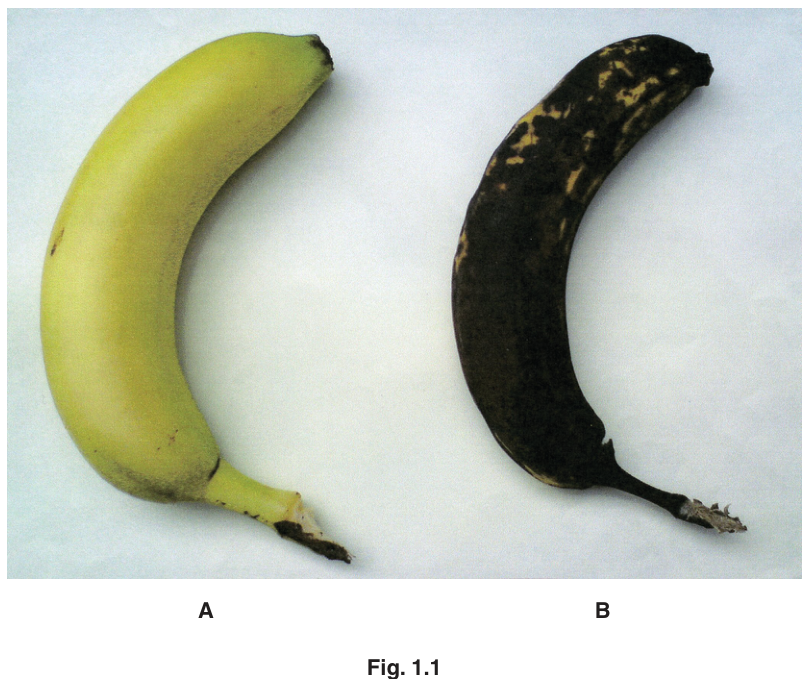
Describe the differences that you can see between the unripe banana fruit A, and the ripe fruit B, shown in Fig. 1.1.
______
Table 1.1 shows the mass of a banana fruit measured over a period of three weeks.
Table 1.1
| day | mass / |
|---|---|
| 1 | 152 |
| 4 | 146 |
| 6 | 140 |
| 7 | 138 |
| 10 | 126 |
| 12 | 122 |
| 15 | 114 |
| 18 | 108 |
| 21 | 98 |
Construct a graph of these results on the grid provided.

Calculate the loss in mass of the banana fruit during the three weeks.
______
Suggest an explanation for the loss in mass during the ripening of the fruit.
______
One of the changes that takes place as a banana fruit ripens is the breakdown of starch to sugar.
Describe how you could carry out a test for reducing sugar on a piece of banana fruit.
______
Explain how would you use this test to show that the reducing sugar content increases during ripening.
______
The rest of this paper
2 more questions- Q2Microscopy and Biological Drawing · Experimental Contexts · Analysis, Conclusions and Evaluation · Observations and Measurements16M
- Q3Microscopy and Biological Drawing · Experimental Contexts7M