Chemistry 5070/32 — October/November 2023
Cambridge O-Level · Practical Test · worked solutions for every part, with the mark scheme
Topics Experimental Contexts · Observations and Measurements · Use of Techniques, Apparatus and Materials · Analysis, Conclusions and Evaluation · Qualitative Analysis · Planning Experiments and Investigations
Sulfuric acid, , is neutralised when it is added to aqueous sodium hydroxide, .
The reaction is exothermic.
is aqueous sodium hydroxide.
is dilute sulfuric acid.
Read all the instructions carefully before starting the experiments.
Instructions
You are going to do six experiments.
Experiment 1
- Rinse and fill a burette with .
- Place the plastic cup into a beaker.
- Use a volumetric pipette to add of to the plastic cup.
- Use a measuring cylinder to add of water to the plastic cup.
- Stir the mixture in the cup with the thermometer and measure its temperature to the nearest .
- Record this initial temperature in column E of Table 1.1.
- Use the burette to add of to the plastic cup whilst stirring.
- Measure the highest temperature reached.
- Record this value in column F of Table 1.1.
- Empty the plastic cup and rinse it with water.
Experiments 2–6
- Repeat Experiment 1 using the volumes of water and shown in columns C and D of the table. Refill the burette as necessary.
- Calculate the temperature rise for each of Experiments 1–6 and record them in column G of Table 1.1.
Table 1.1
| A | B | C | D | E | F | G |
|---|---|---|---|---|---|---|
| experiment number | volume of / | volume of water / | volume of / | initial temperature of mixture / | highest temperature reached / | temperature rise / |
| 1 | 25.0 | 20 | 5.0 | |||
| 2 | 25.0 | 15 | 10.0 | |||
| 3 | 25.0 | 10 | 15.0 | |||
| 4 | 25.0 | 7 | 18.0 | |||
| 5 | 25.0 | 5 | 20.0 | |||
| 6 | 25.0 | 0 | 25.0 |
Working
This is a practical experiment where the candidate must take their own readings. A scoring response requires:
- Initial and final temperatures recorded: All initial temperatures (column E) and highest temperatures reached (column F) must be filled in for Experiments 1–6. Readings must be recorded to the nearest (e.g., , , ).
- Temperature rises calculated: Column G is the difference between the highest temperature and the initial temperature (). All six subtractions must be correct.
- Trend recognised: As the volume of sulfuric acid increases from to , the temperature rise should increase (experiments 1–4). After the equivalence point (around ), the temperature rise will level off or decrease as excess cool acid is added (experiments 4–6).
Answer
See working. The table must be completed with all initial and final temperatures recorded to , correct temperature rises calculated, and the trend showing an initial increase followed by a levelling off or decrease.
See working
Walkthrough
The candidate performs six experiments where the volume of sulfuric acid is varied while the volume of sodium hydroxide is kept constant at . The total volume of liquid in the cup is kept roughly constant ( for Exp 1, etc.) to ensure comparable conditions.
- Recording temperatures (M1, M2): The initial temperature is measured before adding . The highest temperature after adding and stirring is recorded. Both must be read to the nearest . For example, if the initial is and the highest is , the rise is .
- Calculating temperature rise (M3): Column G is simply . These must be mathematically correct.
- Recognising the trend (M4, M5): The reaction is exothermic. As more acid is added up to the equivalence point, more neutralisation occurs, releasing more heat, so the temperature rise increases (M4). Once all the has reacted, adding more just adds cool liquid to the mixture, so the temperature rise stops increasing and may even decrease (M5).
- Accuracy against supervisor results (M6–M8): The candidate's calculated temperature rises should be within of the supervisor's expected values. The closer they are, the more marks they get (up to 3 marks for 5 or 6 correct, 2 for 3 or 4, 1 for 1 or 2).
Key Takeaways
- In temperature change experiments, precision of temperature reading is critical (to ).
- The temperature rise peaks at the equivalence point (complete neutralisation) and then decreases or levels off as excess reactant is added.
Common Mistakes
- Recording temperatures to the wrong precision (e.g., to instead of ).
- Forgetting to subtract correctly when calculating the temperature rise.
- Not recognising that the temperature rise should peak and then fall; candidates sometimes draw or expect a continuous straight line increase.
Things to Be Careful About
- Always read the thermometer to the nearest and record it as such (e.g., , not ).
- Ensure the temperature rise is calculated as , not the other way around.
- The total volume of liquid changes slightly between experiments ( in Exp 1, in Exp 2, etc. — actually , , , , ). The total volume is kept constant at , which is good experimental practice to ensure comparable heat capacity.
Draw a graph of temperature rise against volume of on the grid in Fig. 1.1.
You should:
- plot the point (0,0) as there is no temperature rise when no is added
- plot temperature rise (column G) against volume of (column D) from Experiments 1–6
- draw a straight line of best fit for the first four points
- draw a straight line of best fit for the last three points
- extend the lines so that they intersect.
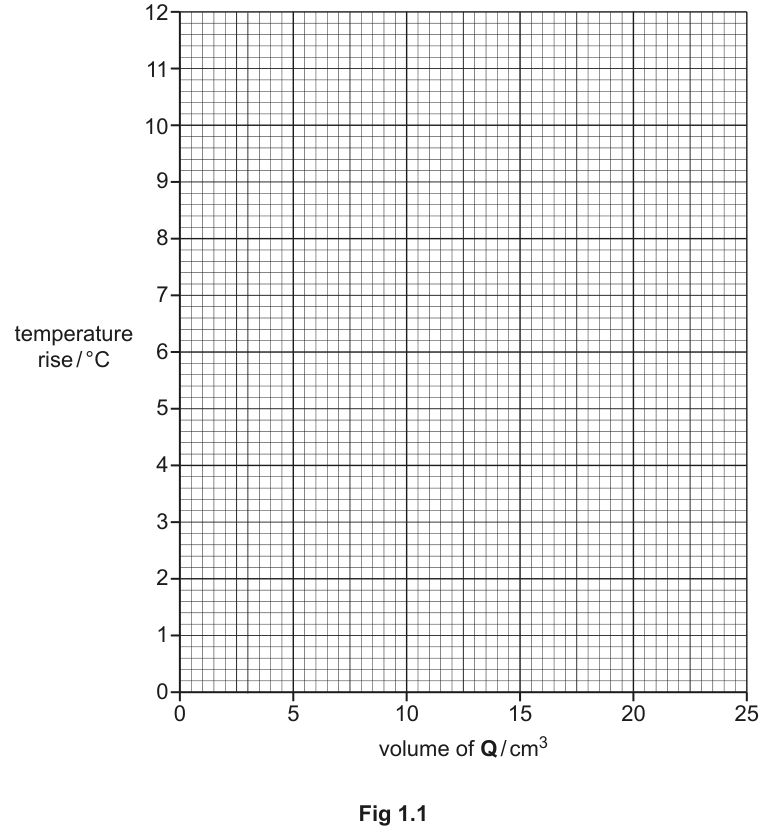
Working
- Plot the origin: Plot the point because no acid added means no temperature rise.
- Plot the data points: Using the values from Table 1.1, plot temperature rise (column G) on the vertical axis against volume of (column D) on the horizontal axis for Experiments 1–6. Points: , , , , , .
- Draw lines of best fit:
- Draw a straight line of best fit through the origin and the first four data points (Experiments 1–4). This line has a positive gradient, showing temperature rise increasing with acid volume.
- Draw a second straight line of best fit through the last three data points (Experiments 4–6). This line will have a smaller positive gradient or a negative gradient, showing the temperature rise levelling off or decreasing.
- Extend and intersect: Extend both straight lines so they cross each other. The intersection point represents the equivalence point where the acid exactly neutralises the base.
Answer
Graph drawn with two straight lines of best fit intersecting at the equivalence point.
See working
Walkthrough
The graph is used to find the exact volume of acid that neutralises the base, which is difficult to pinpoint from discrete data points alone.
- Plotting: The x-axis is volume of ( to ), the y-axis is temperature rise ( to ). Plot and the six experimental points.
- First line (increasing phase): The first four points (volumes ) lie on a line with a steep positive gradient. This is because adding more acid causes more neutralisation, releasing more heat. Draw a straight line through these points and the origin.
- Second line (decreasing/levelling phase): The last three points (volumes ) — note that Experiment 3 () and 4 () might be near the peak, but the mark scheme says 'last three points', which typically means Experiments 4, 5, 6 (). Draw a straight line through these. This line will be less steep or slope downwards because excess cool acid is being added to a solution that can no longer produce more heat.
- Intersection: Extend both lines to meet. The x-coordinate of this intersection is the volume of at the equivalence point.
Key Takeaways
- When titrating with temperature measurement, the graph of temperature rise vs volume of titrant is not a single straight line. It has two linear regions that intersect at the equivalence point.
- The intersection gives a more accurate equivalence volume than any single data point.
Common Mistakes
- Drawing a single curved line of best fit through all points. The mark scheme specifically requires two straight lines.
- Forgetting to plot the point.
- Drawing lines that do not actually intersect within the grid.
Things to Be Careful About
- Points must be plotted to within half a small square.
- Lines of best fit must be straight; do not draw a smooth curve.
- The lines must be extended past the data points to clearly show the intersection.
The point where the two lines intersect indicates the volume of that exactly neutralises of .
Determine the volume of where the two lines on the graph intersect.
volume of ______
Answer
Read the x-coordinate (volume of ) where the two lines of best fit intersect on the graph from part (b).
volume of 12.5 (acceptable range: to )
12.5
Walkthrough
The intersection of the two lines of best fit represents the theoretical point where the amount of acid added is exactly stoichiometric with the base. Read the value on the horizontal axis (volume of ) at this intersection.
Given the concentrations ( for both, as calculated in part d), the equivalence volume is exactly . The candidate's graph should show the intersection near this value. The mark scheme allows a tolerance of .
Key Takeaways
- The intersection of the two linear regions in a temperature-volume graph gives the equivalence point.
- This value is more accurate than reading from a single experimental data point.
Common Mistakes
- Reading the y-coordinate instead of the x-coordinate.
- Reading a value outside the allowed tolerance (e.g., or ).
Things to Be Careful About
- Ensure the reading is taken from the intersection of the extended lines, not just where the data points are closest.
- Read to the nearest or as appropriate for the grid.
is aqueous sodium hydroxide.
Use your answer to (c) to calculate the concentration of sulfuric acid in .
concentration of sulfuric acid in ______
Working
Step 1: Calculate moles of
Step 2: Calculate moles of using the stoichiometry
From the equation:
The mole ratio of is .
Step 3: Calculate concentration of
Using the volume of from part (c), :
Alternatively, using the mark scheme formula directly:
Answer
concentration of sulfuric acid in 1.25
1.25
Walkthrough
This is a standard quantitative titration calculation.
- Moles of base: Convert the volume of from to by dividing by 1000, then multiply by its concentration () to get .
- Stoichiometry: The balanced equation shows that 2 moles of react with 1 mole of . Therefore, divide the moles of by 2 to get the moles of ().
- Concentration of acid: Divide the moles of by the volume of acid used at the equivalence point (from part c, ) to get the concentration ().
Key Takeaways
- Always use the balanced equation to find the mole ratio between reactants.
- Remember to convert volumes from to when calculating concentration in .
Common Mistakes
- Forgetting the 2:1 mole ratio and assuming 1:1.
- Forgetting to divide the volume of acid by 1000 to convert to .
- Using the wrong volume (e.g., instead of the equivalence volume from part c).
Things to Be Careful About
- Carry out calculations to at least 3 significant figures to avoid rounding errors.
- The mark scheme allows error carried forward (ecf) from part (c), so if a candidate reads , they will still get marks for the correct method using .
Describe and explain what happens to the gradient of the straight line for the first four points on the graph if a metal cup is used instead of a plastic cup.
______
Answer
Gradient: The gradient of the straight line for the first four points would be less steep.
Explanation: A metal cup is a better conductor of heat than a plastic cup. Therefore, more energy (heat) is transferred from the solution to the surroundings through the metal cup. This means the measured temperature rise for each addition of acid is lower, resulting in a smaller increase in temperature per of acid added (a less steep gradient).
Gradient is less steep because more heat is lost to the surroundings through the metal cup.
Walkthrough
The question asks about the effect of using a metal cup instead of a plastic cup on the gradient of the temperature rise vs. volume of acid graph.
- Gradient less steep (M1): The gradient represents the temperature rise per unit volume of acid added. If heat is lost to the surroundings, the temperature rise for each addition will be smaller, so the line will be less steep.
- More energy transferred (M2): Metal is a good thermal conductor, while plastic is a poor conductor (insulator). Using a metal cup means more heat from the exothermic reaction is lost to the surroundings (the air, the beaker, the table) rather than being retained in the solution to raise its temperature.
Key Takeaways
- Insulating the reaction vessel (e.g., using a plastic cup or a polystyrene cup) minimises heat loss and gives more accurate temperature measurements.
- Heat loss reduces the measured temperature change, which flattens the slope of the temperature rise graph.
Common Mistakes
- Saying the gradient would be 'steeper' (confusing heat loss with heat gain).
- Not explaining why the gradient changes (must mention heat/energy transfer to surroundings).
- Saying 'the metal cup absorbs heat' without linking it to the surroundings or the gradient.
Things to Be Careful About
- The question asks to 'describe and explain'. You must give both the effect on the gradient (less steep) and the reason (more heat loss to surroundings).
- Use precise language: 'energy transferred from solution to surroundings', not just 'it gets colder'.
A burette may be used instead of a measuring cylinder to measure the volume of water in these experiments.
Suggest how this improves the experiments.
______
Answer
A burette has finer graduations (usually to ) compared to a measuring cylinder (usually to or ). Using a burette to measure the volume of water improves the precision of the volume measurements, reducing the percentage error in the experiment.
Answer
It improves the precision (of the volume of water measured).
It improves the precision of the volume of water measured.
Walkthrough
The question asks how using a burette instead of a measuring cylinder for the water improves the experiment.
- A measuring cylinder is a relatively low-precision apparatus, typically with graduations every or .
- A burette is a high-precision apparatus, with graduations every and the ability to estimate to .
- Using a burette reduces the absolute and percentage error in the volume of water added, making the total volume of liquid in the cup more accurate and consistent across experiments.
Key Takeaways
- Burettes and pipettes are used when high precision is required.
- Measuring cylinders are suitable for rough measurements where exact volume is less critical.
Common Mistakes
- Saying 'it is more accurate' without specifying precision. (While related, 'precision' is the more exact term for the fine graduations).
- Not mentioning the specific improvement (precision of volume measurement).
Things to Be Careful About
- Keep the answer concise. The mark scheme only awards 1 mark for 'improves the precision'.
The rest of this paper
2 more questions- Q2Experimental Contexts · Qualitative Analysis · Observations and Measurements17M
- Q3Experimental Contexts · Planning Experiments and Investigations · Use of Techniques, Apparatus and Materials6M