Chemistry 5070/31 — October/November 2023
Cambridge O-Level · Practical Test · worked solutions for every part, with the mark scheme
Topics Experimental Contexts · Analysis, Conclusions and Evaluation · Observations and Measurements · Use of Techniques, Apparatus and Materials · Qualitative Analysis · Planning Experiments and Investigations
Hydrochloric acid, , is neutralised when it is added to aqueous potassium hydroxide, .
The reaction is exothermic.
P is aqueous potassium hydroxide.
Q is hydrochloric acid.
Read all the instructions carefully before starting the experiments.
Instructions
You are going to do six experiments.
Experiment 1
- Rinse and fill a burette with Q.
- Place the plastic cup into a beaker.
- Use a volumetric pipette to add of P to the plastic cup.
- Use a measuring cylinder to add of water to the plastic cup.
- Stir the mixture in the cup with the thermometer and measure its temperature to the nearest .
- Record this initial temperature in column E of Table 1.1.
- Use the burette to add of Q to the plastic cup whilst stirring.
- Measure the highest temperature reached.
- Record this value in column F of Table 1.1.
- Empty the plastic cup and rinse it with water.
Experiments 2–6
- Repeat Experiment 1 using the volumes of water and Q shown in columns C and D of the table. Refill the burette as necessary.
- Calculate the temperature rise for each of Experiments 1–6 and record them in column G of Table 1.1.
Table 1.1
| A | B | C | D | E | F | G |
|---|---|---|---|---|---|---|
| experiment number | volume of P / | volume of water / | volume of Q / | initial temperature of mixture / | highest temperature reached / | temperature rise / |
| 1 | 25.0 | 20 | 5.0 | |||
| 2 | 25.0 | 15 | 10.0 | |||
| 3 | 25.0 | 10 | 15.0 | |||
| 4 | 25.0 | 7 | 18.0 | |||
| 5 | 25.0 | 5 | 20.0 | |||
| 6 | 25.0 | 0 | 25.0 |
Draw a graph of temperature rise against volume of Q on the grid in Fig. 1.1.
You should:
- plot the point (0,0) as there is no temperature rise when no Q is added
- plot temperature rise (column G) against volume of Q (column D) from Experiments 1–6
- draw a straight line of best fit for the first three points
- draw a straight line of best fit for the last four points
- extend the lines so that they intersect.
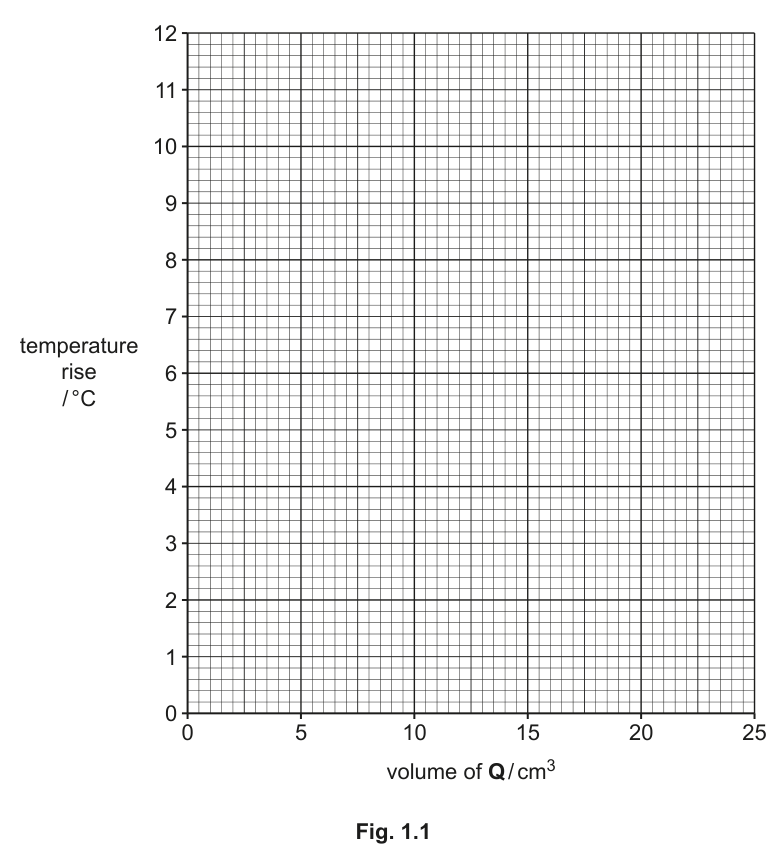
The point where the two lines intersect indicates the volume of Q that exactly neutralises of P.
Determine the volume of Q where the two lines on the graph intersect.
volume of Q = ______
Q is hydrochloric acid.
Use your answer to (c) to calculate the concentration of potassium hydroxide in P.
concentration of potassium hydroxide in P = ______
State and explain why a plastic cup rather than a metal cup is used in these experiments.
______
A measuring cylinder is used to measure the volumes of water.
Suggest why the volumes of water in Table 1.1 are not given to one decimal place.
______
The rest of this paper
2 more questions- Q2Qualitative Analysis · Experimental Contexts · Analysis, Conclusions and Evaluation17M
- Q3Planning Experiments and Investigations · Experimental Contexts6M