Chemistry 5070/41 — May/June 2020
Cambridge O-Level · Alternative to Practical · worked solutions for every part, with the mark scheme
Topics Experimental Contexts · Observations and Measurements · Analysis, Conclusions and Evaluation · Use of Techniques, Apparatus and Materials · Qualitative Analysis · Planning Experiments and Investigations
A student investigates a sample of rock salt.
The student:
- grinds the rock salt into a powder
- places the powder into a beaker and adds water to it
- stirs the mixture
- pours the mixture through the apparatus shown.
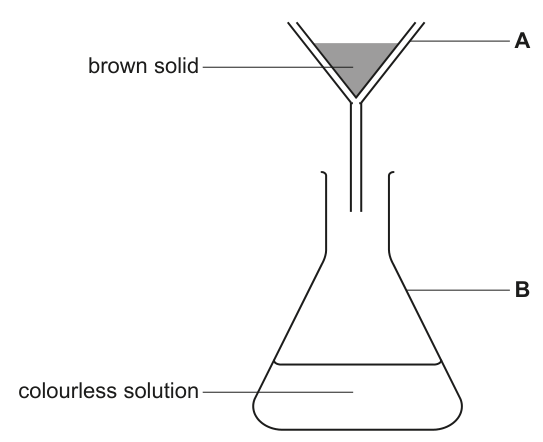
Name apparatus A.
______
Name apparatus B.
______
A brown solid remains in apparatus A. A colourless solution is collected in apparatus B.
Name the process used to separate the solid from the colourless solution.
______
The colourless solution contains two different cations. One cation is sodium.
The student adds dilute nitric acid and aqueous sodium sulfate to the colourless solution.
A white precipitate is formed.
Name the other cation in the colourless solution.
______
A student investigates the effect of adding different masses of rock salt on the temperature of a mixture of ice and water.
The diagram shows the volume of water the student uses in the investigation.
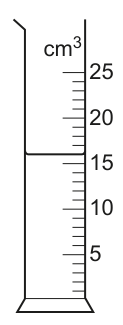
State the volume of water the student uses. = ______
The student:
- places the water in a beaker
- adds ice
- stirs the mixture
- measures the lowest temperature of the mixture
- repeats the experiment four times.
In each of the repeated experiments a different mass of rock salt is added to the mixture.
State a variable that needs to be kept constant in each experiment.
______
The diagram shows part of the thermometer the student uses to measure the lowest temperature reached when of rock salt is added.
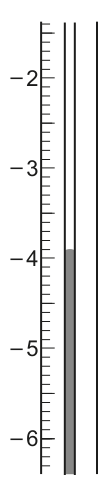
Record this temperature in the table of results.
| mass of rock salt added / | lowest temperature of ice and salt mixture / |
|---|---|
| 0.0 | 0.0 |
| 0.5 | –1.9 |
| 1.0 | |
| 1.5 | –5.8 |
| 2.0 | –7.8 |
Plot the results on the grid.
Include:
- a suitable scale for the x-axis
- a straight line of best fit.
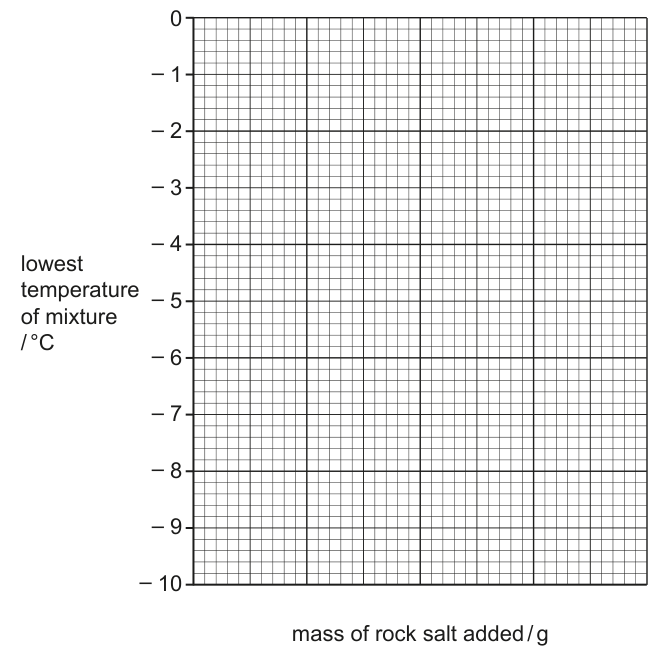
Use your graph to find the lowest temperature when of rock salt is added.
______
Deduce the relationship between the mass of rock salt added and the lowest temperature reached.
______
The rest of this paper
5 more questions- Q2Observations and Measurements · Experimental Contexts · Use of Techniques, Apparatus and Materials · Analysis, Conclusions and Evaluation12M
- Q3Planning Experiments and Investigations · Experimental Contexts · Observations and Measurements5M
- Q4Qualitative Analysis · Observations and Measurements12M
- Q5Experimental Contexts · Use of Techniques, Apparatus and Materials · Analysis, Conclusions and Evaluation14M
- Q6Experimental Contexts · Observations and Measurements · Analysis, Conclusions and Evaluation5M