Chemistry 5070/32 — May/June 2020
Cambridge O-Level · Practical Test · worked solutions for every part, with the mark scheme
Topics Observations and Measurements · Experimental Contexts · Analysis, Conclusions and Evaluation · Use of Techniques, Apparatus and Materials · Qualitative Analysis
Magnesium reacts with dilute hydrochloric acid to form magnesium chloride and hydrogen.
The equation for this reaction is shown.
You are going to investigate the effect of the concentration of hydrochloric acid on the rate of the reaction.
P is hydrochloric acid.
Q is magnesium ribbon.
Use the apparatus shown with the boiling tube in a rack and the measuring cylinder supported with a stand and clamp.
Fill the trough and measuring cylinder with water.
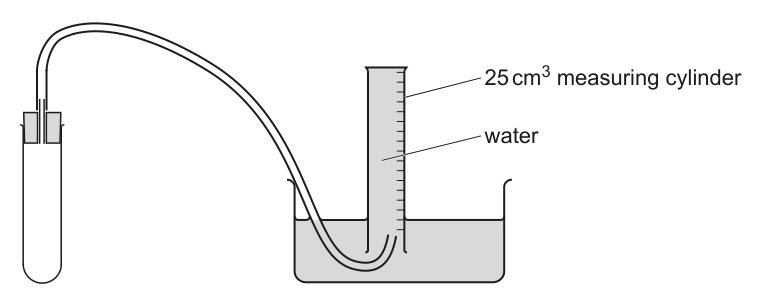
- Remove the bung from the boiling tube.
- Place one strip of Q into the boiling tube.
- In experiment 1 add of water and then of P to the boiling tube.
- Quickly insert the bung back into the boiling tube.
- Immediately start timing.
- Stop timing when of hydrogen has been collected. Record the time taken to the nearest second in the table.
- Repeat the experiment four more times using the volumes of P and water shown in the table.
| experiment | 1 | 2 | 3 | 4 | 5 |
|---|---|---|---|---|---|
| volume of water/ | 4.0 | 3.0 | 2.0 | 1.0 | 0.0 |
| volume of P/ | 6.0 | 7.0 | 8.0 | 9.0 | 10.0 |
| time to produce gas/ s | |||||
| concentration of P in | 2.0 |
Answer
The table must be completed with the candidate's own timing readings. The procedure is as follows:
- Setup: Ensure the trough and measuring cylinder are filled with water. The boiling tube is in the rack, connected to the inverted measuring cylinder via the delivery tube.
- Experiment 1: Add of water and of P ( HCl) to the boiling tube containing the magnesium ribbon. Insert the bung immediately and start the timer. Stop when of gas is collected. Record time in seconds (no decimals).
- Repeats: Repeat for experiments 2–5 using the volumes in the table. Ensure the total volume of liquid in the boiling tube is always (, , etc.).
- Trend: The times should generally decrease as the concentration of acid increases (experiments 1 to 5).
Sample completed table (values are illustrative, candidate must use own readings):
| experiment | 1 | 2 | 3 | 4 | 5 |
|---|---|---|---|---|---|
| volume of water / | 4.0 | 3.0 | 2.0 | 1.0 | 0.0 |
| volume of P / | 6.0 | 7.0 | 8.0 | 9.0 | 10.0 |
| time to produce gas / s | 45 | 38 | 32 | 28 | 25 |
| concentration of P in | 1.2 | 1.4 | 1.6 | 1.8 | 2.0 |
See working. Record times to the nearest second; values should show a descending trend as concentration increases.
Walkthrough
This part tests the candidate's ability to conduct a quantitative practical investigation into reaction rates. The method involves collecting hydrogen gas over water using an inverted measuring cylinder.
- Apparatus: The delivery tube must be submerged in the water in the trough before the reaction starts to ensure all gas is collected. The bung must be inserted quickly to prevent gas loss.
- Measurements: Volumes of water and acid P are measured using measuring cylinders. The total volume is kept constant at to ensure the volume of magnesium exposed and the total reaction volume are comparable, although the concentration changes.
- Timing: The timer starts immediately upon mixing and stops when the meniscus of the gas in the measuring cylinder reaches the mark. Times should be recorded to the nearest second (whole numbers only).
- Repeats: Five experiments are performed. As the volume of acid P increases (and water decreases), the concentration of HCl increases. Higher concentration leads to more frequent collisions between reactant particles, so the rate increases and the time taken to collect decreases. Thus, the time values should show a descending trend from experiment 1 to 5.
Key Takeaways
- Gas collection over water is a standard method for measuring volume of gas produced in a reaction.
- Timing must start immediately and stop at a specific volume to measure rate.
- Data should be recorded with appropriate precision (nearest second for this apparatus).
Common Mistakes
- Fractional seconds: Recording times like is incorrect; the apparatus (manual stopwatch) only supports whole seconds.
- Incorrect volumes: Adding the wrong volumes of water and acid, changing the total volume or the initial concentration incorrectly.
- Gas loss: Not inserting the bung quickly enough, leading to lower recorded volumes or inaccurate times.
Things to Be Careful About
- Precision: Readings must be non-fractional seconds.
- Trend: The times must decrease as concentration increases. If times increase, the data is anomalous or the experiment was flawed.
- Total Volume: The sum of water and P must be for all experiments to keep conditions consistent (though concentration is the independent variable).
P is hydrochloric acid.
Calculate the concentration of hydrochloric acid in each experiment.
Write your answers in the table.
Answer
The concentration of P in each experiment is calculated using the dilution formula:
Where:
- (concentration of stock solution P)
- (total volume: )
Rearranging for :
- Experiment 1:
- Experiment 2:
- Experiment 3:
- Experiment 4:
- Experiment 5:
Completed table row:
| experiment | 1 | 2 | 3 | 4 | 5 |
|---|---|---|---|---|---|
| concentration of hydrochloric acid in | 1.2 | 1.4 | 1.6 | 1.8 | 2.0 |
1.2, 1.4, 1.6, 1.8, 2.0
Walkthrough
The question asks for the concentration of hydrochloric acid in the boiling tube for each experiment. The stock solution P is . Water is added to dilute it.
- The total volume of liquid in the boiling tube is constant: (and similarly for other rows: , , etc.).
- Using : .
- .
- For exp 1: .
- For exp 5: (no dilution).
Key Takeaways
- Dilution calculations are common in rate experiments where concentration is the independent variable.
- Keeping the total volume constant ensures that the only changing factor is the concentration of the reactant.
Common Mistakes
- Forgetting total volume: Using (volume of acid) instead of (total volume).
- Incorrect arithmetic: Simple multiplication errors.
Things to Be Careful About
- Units: Concentration is in . Volumes can be in as long as they are consistent (ratio cancels units).
- Significant figures: The volumes are given to 1 decimal place (, ), so answers like (2 s.f.) are appropriate. The mark scheme accepts .
Use data from the table to plot a graph of the concentration of hydrochloric acid (-axis) against the time taken to collect of hydrogen (-axis).
Draw a curve of best fit.

Answer
Graph Construction:
- Axes:
- x-axis: Concentration of hydrochloric acid / . Range: to (or to ). Scale must use at least 50% of the axis length.
- y-axis: Time to produce gas / s. Range: depends on candidate data, but typically to . Scale must use at least 50% of the axis length.
- Plotting: Plot the 5 pairs of (concentration, time) from the table in part (a) and (b). Points should be plotted to within half a small square of the grid intersection.
- Curve of Best Fit: Draw a smooth curve. Since rate increases with concentration, time decreases as concentration increases. The curve should be downward sloping and likely curved (inverse relationship), not a straight line.
Example Graph Description (using sample data from part a):
- Points: .
- The curve starts high on the left and drops steeply then flattens out towards the right.
See working. Graph with concentration on x-axis, time on y-axis, 5 plotted points, and a smooth downward curve of best fit.
Walkthrough
The candidate must plot a graph to show the relationship between concentration and time (which is inversely related to rate).
- x-axis: Independent variable is concentration of HCl. Values: . Label: "concentration of hydrochloric acid / mol/dm³".
- y-axis: Dependent variable is time. Values are from the candidate's table. Label: "time to produce 18 cm³ gas / s".
- Scales: Must be chosen so that the data uses at least 50% of the available axis length. For x-axis, a range of to with major divisions of is good. For y-axis, if times are , a range of to with major divisions of or is appropriate.
- Plotting: Each point must be plotted accurately. Mark scheme awards 2 marks for 5 correct points, 1 mark for 4.
- Curve: The relationship is not linear. Higher concentration means faster reaction, so less time. The curve should be smooth and pass close to all points (curve of best fit). It should not be a straight line connecting points.
Key Takeaways
- Graphs in 5070 must have labelled axes with units.
- Scales must utilize the available grid space (at least 50%).
- Curve of best fit is required for non-linear relationships; do not join points with straight lines.
Common Mistakes
- Missing units on axes: "concentration" and "time" are not enough; units (, s) are required.
- Poor scaling: Starting x-axis at when data is wastes space and reduces accuracy.
- Straight line: Connecting points with straight lines instead of a smooth curve.
- Incorrect plotting: Misreading the grid or swapping x and y values.
Things to Be Careful About
- Axis labels: Must include variable name AND unit (e.g., "concentration / mol dm⁻³").
- Curve shape: The curve should show that as concentration increases, time decreases. The rate of decrease in time should slow down (curve flattens) as concentration increases.
Calculate the number of moles of hydrogen, , in of hydrogen at room temperature and pressure (r.t.p.).
[The volume of one mole of hydrogen is at r.t.p.]
number of moles of hydrogen = ______
Working
Molar volume of gas at r.t.p. = .
Answer
number of moles of hydrogen =
0.00075 mol
Walkthrough
The question asks for the number of moles of hydrogen gas in at room temperature and pressure (r.t.p.).
- At r.t.p., 1 mole of any gas occupies (or ).
- Formula: .
- Calculation: .
Key Takeaways
- The molar gas volume at r.t.p. is (or ). Remember to match units (cm³ vs dm³).
- This is a fundamental conversion in quantitative chemistry.
Common Mistakes
- Unit mismatch: Using with volume in without converting ().
- Inversion: Calculating instead of .
Things to Be Careful About
- Significant figures: The answer has 2 significant figures. The mark scheme accepts .
- State: Hydrogen is a gas, so molar volume applies.
Use your answer from (d) to calculate the number of moles of that react to form of at r.t.p.
number of moles of = ______
Working
From the balanced equation:
The mole ratio of to is .
Answer
number of moles of HCl =
0.00150 mol
Walkthrough
The question asks for the moles of HCl that react to produce the of hydrogen calculated in part (d).
- Look at the balanced chemical equation: .
- The coefficients show that 2 moles of HCl produce 1 mole of H₂.
- Therefore, moles of HCl = moles of H₂.
- Calculation: .
Key Takeaways
- Stoichiometry links the amounts of reactants and products.
- Always check the balanced equation for the correct mole ratio.
Common Mistakes
- Wrong ratio: Using 1:1 ratio instead of 2:1.
- Calculation error: (acceptable) or (better to show precision).
Things to Be Careful About
- Sig figs: maintains 3 sig figs (or 2, depending on interpretation, but is fine). The mark scheme gives .
- Context: This is the amount of HCl reacted, not necessarily the amount present in the solution (though in exp 5, all HCl might react if Mg is in excess, but here we calculate based on the gas produced).
Use data from the table and your answer from (e) to calculate the mean rate of reaction, in , of P in experiment 5.
Give your answer to two significant figures.
mean rate of reaction in experiment 5 = ______
Working
Mean rate of reaction =
From part (e), moles of HCl reacted to produce of H₂ = .
For experiment 5, let the time taken from the table be seconds (candidate's reading).
Example calculation (using sample time from part a, t = 25 s):
Significant figures: The answer must be given to two significant figures.
has two significant figures (6 and 0).
Answer
mean rate of reaction in experiment 5 =
(Using sample time : or )
0.00150 / (time for exp 5) mol/s. Example: 0.000060 mol/s (to 2 s.f.)
Walkthrough
The question asks for the mean rate of reaction of P (HCl) in experiment 5.
- Formula: Rate = . Here, amount is moles of HCl reacted.
- Moles: From part (e), we know that to produce of H₂, of HCl reacts. This is a fixed amount regardless of concentration (since the gas volume collected is fixed at ).
- Time: The time for experiment 5 is the candidate's reading from the table. Let's call it .
- Calculation: Rate = .
- Significant figures: The question asks for two significant figures. has 3 s.f. The time (e.g., 25) has 2 s.f. So the result should be to 2 s.f.
- Example: If , Rate = . In scientific notation: . Both are 2 s.f.
Key Takeaways
- Rate can be calculated as moles per unit time.
- The amount of reactant reacted is determined by the amount of product collected (fixed volume of gas).
- Significant figures must be applied to the final answer.
Common Mistakes
- Using volume instead of moles: Calculating rate as (volume/time) instead of moles/time. The question asks for rate in .
- Wrong moles: Using moles of H₂ () instead of moles of HCl ().
- Sig figs: Giving answer to 3 or 4 sig figs (e.g., ). Must be 2 s.f.
- Units: Forgetting the unit .
Things to Be Careful About
- Candidate data: The final numerical answer depends on the time recorded in part (a). The marking scheme allows ecf (error carried forward) from the time, but uses the correct moles from (e).
- Format: is correct. is also correct. Avoid (1 s.f.).
The rest of this paper
1 more questions- Q2Experimental Contexts · Observations and Measurements · Qualitative Analysis · Analysis, Conclusions and Evaluation23M