Physics 5054/42 — October/November 2025
Cambridge O-Level · Alternative to Practical · worked solutions for every part, with the mark scheme
Topics Observations and Measurements · Experimental Contexts · Use of Techniques, Apparatus and Materials · Analysis, Conclusions and Evaluation · Planning Experiments and Investigations
A student investigates a light dependent resistor (LDR).
The student constructs a series circuit consisting of a power supply, the LDR, a 560 resistor and a switch.
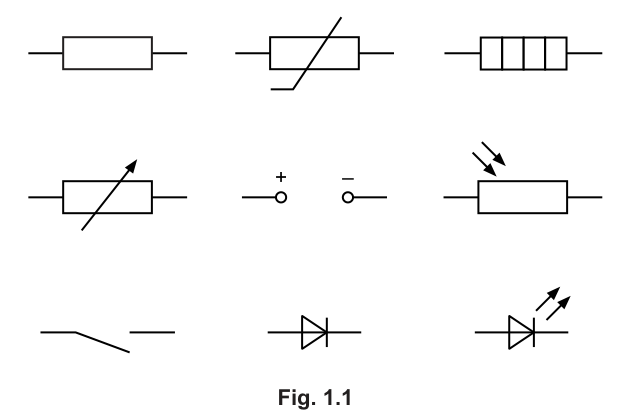
Draw a diagram of the circuit arrangement, using the correct symbols for the components in the circuit.
Choose from the symbols shown in Fig. 1.1.
Answer
A series circuit consisting of a power supply (battery), an open switch, a light-dependent resistor (LDR) and a 560 fixed resistor, all connected in a single loop. No other components are included.
Series circuit diagram with battery, switch, LDR and 560 resistor.
Walkthrough
The question asks for a diagram of a series circuit containing a power supply, an LDR, a 560 resistor and a switch. In a series circuit, all components are connected end-to-end in a single loop so that the same current flows through each. Using the symbols provided in Fig. 1.1:
- Power supply: the four-cell battery symbol (or the open +/– terminals).
- Switch: the open switch symbol.
- LDR: the resistor symbol with two inward-pointing arrows.
- Fixed resistor: the plain rectangle symbol.
Connect them in any order around the loop. The voltmeter is not part of this diagram; it is added in part (b)(i).
Key Takeaways
Candidates must recognise and reproduce standard circuit symbols accurately and understand that 'series' means a single continuous path for current.
Common Mistakes
- Including extra components not mentioned in the question (e.g., an ammeter or a second resistor).
- Drawing the voltmeter in series with the circuit (a voltmeter must be in parallel with the component it measures).
- Using the wrong symbol for the LDR (e.g., confusing it with a thermistor or a variable resistor).
Things to Be Careful About
Ensure all four required components are present and that the connections form a complete series loop. The switch may be drawn open or closed in the diagram, but it must be the correct symbol.
The student:
- closes the switch
- connects a voltmeter across the LDR
- records the voltmeter reading
- opens the switch.
On your circuit in (a), draw a voltmeter connected across the LDR to measure the potential difference (p.d.) across the LDR.
Use the circuit symbol for a voltmeter.
Answer
On the circuit drawn in (a), add a voltmeter symbol (a circle with a 'V' inside) connected in parallel across the LDR. The voltmeter's two leads should connect to the wires on either side of the LDR, forming a separate branch that does not break the series loop.
Voltmeter symbol in parallel across the LDR.
Walkthrough
A voltmeter measures the potential difference (p.d.) across a component and must always be connected in parallel with that component. Draw a circle with a 'V' inside. Connect one lead to the wire between the fixed resistor and the LDR, and the other lead to the wire between the LDR and the switch. This creates a parallel branch across the LDR without affecting the main series current.
Key Takeaways
Voltmeters are always connected in parallel with the component whose p.d. is being measured. Ammeters, by contrast, are connected in series.
Common Mistakes
- Connecting the voltmeter in series with the LDR (this would break the circuit or give an incorrect reading because voltmeters have very high resistance).
- Connecting the voltmeter across the wrong component (e.g., across the 560 resistor or the battery).
Things to Be Careful About
Ensure the voltmeter symbol is a circle with a 'V', not an 'A'. The connections must be to the wires on either side of the LDR only.
Answer
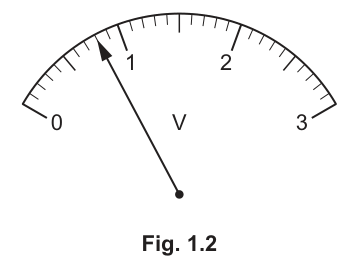
The scale runs from 0 to 3 V with 10 minor divisions between each integer, so each minor division represents 0.1 V. The needle points to the 8th minor division past 0.
= 0.8 V
0.8 V
Walkthrough
Fig. 1.2 shows an analogue voltmeter with a range of 0 to 3 V. Between 0 and 1, there are 10 small divisions, meaning each small division is worth V. The needle is pointing exactly at the 8th small division after 0. Therefore, the reading is V. Reading to one decimal place is appropriate here as the scale divisions justify it (0.80 V is also acceptable, but 0.8 V is the standard 5054 expectation for this scale).
Key Takeaways
Always determine the value of each small division on an analogue scale before reading the needle position. For a 0-3 V scale with 10 divisions per volt, the precision is 0.1 V.
Common Mistakes
- Reading the needle position incorrectly (e.g., counting from the wrong end or misinterpreting the major markings).
- Giving a reading with too many decimal places (e.g., 0.77 V or 0.78 V) when the scale only supports 0.1 V precision.
Things to Be Careful About
Ensure you read the scale in volts (V), not any other unit. The needle is at 0.8 V; do not over-estimate the precision of the instrument.
Answer
The switch is opened to prevent the circuit components (especially the resistor and the LDR) from heating up, which would change their resistance and affect the accuracy of the reading. It also prevents the battery from draining unnecessarily.
To stop the circuit from heating up and to prevent the battery from draining.
Walkthrough
When current flows through a circuit for an extended period, resistors and other components dissipate energy as thermal energy (heating up). For an LDR or a standard resistor, a rise in temperature can change its resistance, meaning the voltmeter reading would drift and no longer represent the condition at the moment of measurement. Additionally, leaving a circuit closed drains the battery. Opening the switch immediately after recording the reading minimises these effects.
Key Takeaways
In practical electrical investigations, switches should be opened quickly after taking readings to prevent heating (which alters resistance) and battery drain.
Common Mistakes
- Saying 'to save electricity' without linking it to the specific effect on the components (heating changes resistance).
- Saying 'to stop the battery from exploding' or other irrelevant safety hazards.
Things to Be Careful About
The mark scheme specifically looks for 'heating up' or 'battery running down'. Use precise physics language: 'thermal energy' or 'heating', not just 'heat'.
The student:
- disconnects the voltmeter
- reconnects the voltmeter across the 560 resistor
- closes the switch
- records the voltmeter reading
- opens the switch.
The student measures as 2.18 V.
The current in the circuit is calculated using the equation:
where .
Calculate the current .
= ______
Working
Answer
= 0.0039 A
0.0039 A
Walkthrough
The voltmeter across the 560 resistor reads V. Since the resistor value is known, the current in the series circuit can be found using Ohm's law: .
Rounding to 2 or 3 significant figures gives A or 0.0039 A. The mark scheme accepts A or 0.0039 A.
Key Takeaways
Ohm's law can be rearranged to find current: . Always include the correct unit (amperes, A) in the final answer.
Common Mistakes
- Forgetting to divide by the resistance and just writing down the voltage.
- Rounding too early or too much; keep at least 3 significant figures in intermediate calculations to avoid round-off errors in later parts.
Things to Be Careful About
The current is small (in the milliamp range), so scientific notation or a clear decimal representation (0.0039) is needed. Do not confuse this current with the current through the voltmeter; the voltmeter has very high resistance and draws negligible current, so the current through the 560 resistor is effectively the total circuit current.
Use your answers from (b)(ii) and (c)(i) to calculate the resistance of the LDR under normal lighting conditions, using the equation shown.
= ______
Working
Using V and A:
Rounding to 3 significant figures:
Answer
= 206
206
Walkthrough
The question asks for the resistance of the LDR under normal lighting conditions. We have the p.d. across the LDR from part (b)(ii): V. We have the current through the LDR from part (c)(i): A (since it is a series circuit, the current is the same everywhere).
Using Ohm's law rearranged for resistance:
The mark scheme accepts 205, 206, or 210 (210 comes from using or similar rounding). Using 206 is appropriate.
Key Takeaways
In a series circuit, the current is the same through all components. Ohm's law can be applied to any individual component using its p.d. and the circuit current.
Common Mistakes
- Using the wrong voltage value (e.g., using V instead of V for the LDR resistance).
- Carrying forward an incorrect current value from part (c)(i) without using the 'ecf' (error carried forward) principle; examiners will accept calculations based on the candidate's own (possibly wrong) answer from (c)(i), but here we use the correct value.
Things to Be Careful About
Ensure the unit (ohms) is included in the final answer. The value 206 is reasonable for an LDR in normal lighting conditions.
The student:
- disconnects the voltmeter from across the 560 resistor
- reconnects the voltmeter across the LDR
- places a piece of card on top of the LDR to prevent light from reaching the LDR
- closes the switch
- records the voltmeter reading
- opens the switch.
The student measures as 1.94 V.
Compare , measured under normal lighting conditions in (b)(ii), with , measured in the dark.
Suggest what causes the change in the readings as the intensity of the light reaching the LDR decreases.
Answer
(1.94 V) is greater than (0.8 V). The p.d. across the LDR increases when it is placed in the dark. This happens because the resistance of the LDR increases as the light intensity decreases, causing a larger share of the supply voltage to be dropped across it.
Cause: The resistance of the LDR increases in the dark.
The resistance of the LDR increases as light intensity decreases.
Walkthrough
In part (b)(ii), the p.d. across the LDR in normal light was V. In part (d), with the LDR in the dark (card placed on top), the p.d. is V. The p.d. across the LDR has increased significantly.
In a series circuit with a fixed resistor and an LDR, the supply voltage is divided between them in proportion to their resistances (voltage divider rule). If the p.d. across the LDR increases, its resistance must have increased relative to the fixed resistor. Therefore, the LDR's resistance is higher in the dark than in normal light.
Key Takeaways
LDRs have high resistance in the dark and low resistance in bright light. In a series circuit, a higher resistance component takes a larger share of the total voltage.
Common Mistakes
- Saying 'the voltage increases because the current increases' (this is incorrect; if LDR resistance increases, the total circuit resistance increases, so the total current actually decreases).
- Not stating that it is the resistance of the LDR that changes.
Things to Be Careful About
The question asks to 'suggest what causes the change'. The direct physical cause is the increase in resistance of the LDR material when light photons are no longer freeing charge carriers. Keep the explanation focused on resistance.
The student:
- holds the card horizontally 50 cm above the LDR
- slowly moves the card towards the LDR until it rests on top of the LDR
- observes the readings on the voltmeter across the LDR as the card is moved.
Table 1.1 shows the voltmeter readings as the distance between the card and the LDR decreases.
Table 1.1
| 30 | 0.77 |
| 25 | 0.76 |
| 20 | 0.77 |
| 15 | 0.76 |
| 10 | 0.84 |
| 5 | 0.99 |
| 0 | 1.94 |
Describe the relationship between and shown by these readings.
Answer
As the distance decreases from 30 cm to 15 cm, the voltmeter reading is initially roughly constant (around 0.76–0.77 V). As the distance decreases further from 15 cm to 0 cm (as the card gets close to or rests on the LDR), the voltmeter reading increases significantly (up to 1.94 V).
In summary: is approximately constant at larger distances, then increases sharply as the card approaches and covers the LDR.
V is roughly constant from 30 cm to 15 cm, then increases as d decreases from 15 cm to 0 cm.
Walkthrough
Examine Table 1.1:
- At cm, is 0.77, 0.76, 0.77, 0.76 V. These values are essentially constant (fluctuating by 0.01 V, likely due to reading precision or minor ambient light variations).
- At cm, V (starting to rise).
- At cm, V (rising more steeply).
- At cm, V (fully covered, dark).
The relationship is not linear. The voltage across the LDR stays roughly the same while the card is far away (normal lighting conditions), but as the card gets very close and begins to block the light significantly, the voltage rises sharply as the LDR's resistance increases.
Key Takeaways
When describing data, look for trends and changes in trend. Do not just say 'it increases'; specify where it is constant and where it changes. This shows a deeper understanding of the data.
Common Mistakes
- Saying 'V increases as d decreases' without mentioning the initial constant region. This misses the first marking point.
- Fitting a straight line to data that is clearly non-linear.
Things to Be Careful About
Use the exact terminology from the data: 'roughly constant' or 'doesn't change much' for the 30-15 cm range, and 'increases' for the 15-0 cm range. The mark scheme awards one mark for each distinct behaviour observed.
A student investigates the absorption of thermal radiation by different coloured surfaces.
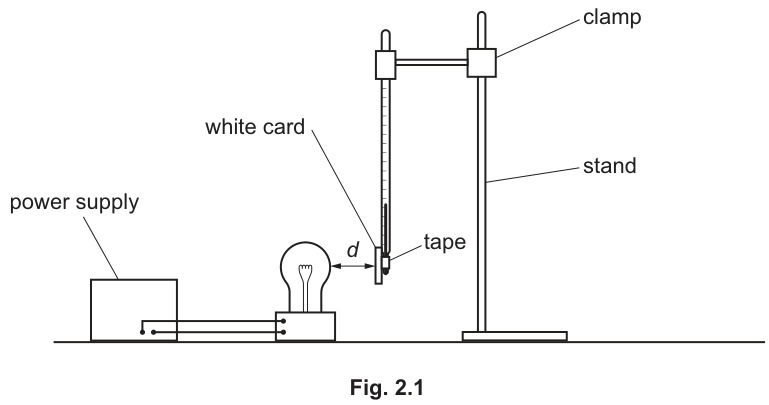
The student has arranged a thermometer which has a piece of white card attached to its bulb so that the bulb is level with the filament of a lamp.
The lamp is switched off.
Fig. 2.1 shows the apparatus.
procedure
The student:
- adjusts the distance between the white card attached to the thermometer bulb and the lamp until it is approximately 1 cm
- records, in Table 2.1, the initial temperature recorded by the thermometer.
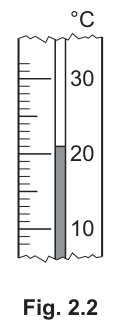
The thermometer is shown in Fig. 2.2.
Record in Table 2.1 at time .
Answer
21.0
21.0 °C
Walkthrough
The thermometer scale in Fig. 2.2 has major markings at 10, 20 and 30 °C with 1 °C subdivisions. The liquid level is exactly one mark above 20 °C, giving a reading of 21 °C. To match the precision of the scale, we record it as 21.0 °C.
Key Takeaways
Always read liquid-in-glass thermometers to the precision of the smallest division on the scale, including a trailing zero if appropriate.
Common Mistakes
Writing 21 instead of 21.0, or reading the meniscus incorrectly. The mark scheme accepts 21 or 21.0.
Things to Be Careful About
The scale is marked in °C. Ensure the reading is taken at eye level with the top of the liquid column (meniscus).
The student:
- switches on the lamp and, at the same time, starts the stop-watch
- records, in Table 2.1, the reading on the thermometer every 60 s for 5 minutes
- switches off the lamp.
The student's results are shown in Table 2.1.
Table 2.1
| white card | black card | |
|---|---|---|
| 0 | ______ | 20 |
| ______ | 24 | 28 |
| ______ | 26 | 33 |
| ______ | 28 | 37 |
| ______ | 30 | 41 |
| ______ | 31 | 44 |
Complete Table 2.1 by completing the time column.
Answer
60, 120, 180, 240, 300
60, 120, 180, 240, 300
Walkthrough
The student records the temperature every 60 s for 5 minutes. Five minutes is 300 s. Starting from t = 0, the subsequent readings are at 60 s, 120 s, 180 s, 240 s and 300 s. These values fill the blanks in the time column.
Key Takeaways
When completing a results table, ensure the independent variable (time) progresses logically and covers the full duration of the experiment.
Common Mistakes
Forgetting that 5 minutes equals 300 s, or starting the sequence at 60 instead of filling the blanks correctly.
Things to Be Careful About
The table already has the unit '/ s' in the column heading, so only the numerical values are needed in the blanks.
The student
- removes the thermometer from the clamp
- replaces it with a thermometer with a black card attached to its bulb
- repeats the procedure in (a) and records temperatures .
Determine the temperature increase between and for each card.
for white card = ______
for black card = ______
Working
For white card: Δθ = 31 - 21.0 = 10.0 °C
For black card: Δθ = 44 - 20 = 24.0 °C
Answer
10.0 °C and 24.0 °C
10.0 °C and 24.0 °C
Walkthrough
The temperature increase Δθ is the final temperature at t = 300 s minus the initial temperature at t = 0 s. From the table, the white card goes from 21.0 °C to 31 °C, giving Δθ = 31 - 21.0 = 10.0 °C. The black card goes from 20 °C to 44 °C, giving Δθ = 44 - 20 = 24.0 °C.
Key Takeaways
Temperature increase is always final temperature minus initial temperature. Ensure you use the correct initial reading for each card (21.0 °C for white, 20 °C for black).
Common Mistakes
Using the wrong initial temperature for one of the cards, or subtracting in the wrong order (getting a negative value).
Things to Be Careful About
Keep one decimal place consistent where appropriate. The mark scheme accepts 10 and 24, but 10.0 and 24.0 are better practice.
Calculate the rate of increase of temperature of each card. Use the equation:
Include the unit in your answer.
rate of temperature increase of white card = ______ unit ______
rate of temperature increase of black card = ______ unit ______
Working
Rate for white card = 10.0 / 300 = 0.033 °C/s
Rate for black card = 24.0 / 300 = 0.080 °C/s
Answer
0.033 °C/s and 0.080 °C/s
0.033 °C/s and 0.080 °C/s
Walkthrough
The formula given is rate of temperature increase = Δθ / t. The time t is 300 s for both cards.
For the white card: rate = 10.0 / 300 = 0.0333... ≈ 0.033 °C/s.
For the black card: rate = 24.0 / 300 = 0.080 °C/s.
The unit is °C per second, written as °C/s.
Key Takeaways
When calculating a rate, divide the change in quantity by the time taken. Always include the correct derived unit.
Common Mistakes
Forgetting the unit °C/s, or using the wrong time value (e.g. 5 instead of 300).
Things to Be Careful About
The mark scheme specifically awards one mark for the numerical answers and one mark for the unit. Ensure the unit is written exactly as °C/s.
Use your answers to (b)(ii) to reach a conclusion which compares the absorption of thermal radiation by the two different cards.
State your conclusion.
Answer
The black card is a better absorber of thermal radiation.
The black card is a better absorber of thermal radiation.
Walkthrough
The black card showed a much larger rate of temperature increase (0.080 °C/s) compared to the white card (0.033 °C/s). Since both cards are at the same distance from the same lamp, the black card must be absorbing more thermal radiation from the lamp, causing its temperature to rise faster. Therefore, the black surface is a better absorber.
Key Takeaways
A faster rate of temperature increase under identical irradiation conditions indicates a better absorber of thermal radiation.
Common Mistakes
Saying 'black absorbs more heat' without referencing thermal radiation, or saying 'black is hotter' without explaining the absorption.
Things to Be Careful About
The conclusion must directly compare the two surfaces and reference thermal radiation (or heat) absorption.
A student suggests that the rate of temperature increase is greater at the start of the experiment than at the end.
State if the results for the black card support this suggestion.
Justify your answer by referring to the results.
statement ______
justification ______
Answer
Statement: YES
Justification: The temperature increase in the first 60 s is 8 °C (28 - 20), which is greater than the increase in the last 60 s of 3 °C (44 - 41).
YES; the temperature rise in the first 60 s (8 °C) is greater than in the last 60 s (3 °C).
Walkthrough
The suggestion is that the rate of temperature increase is greater at the start than at the end. To check this using the black card results, we compare the temperature rise over the first 60 s with the rise over the last 60 s.
First 60 s (t = 0 to 60): 28 - 20 = 8 °C.
Last 60 s (t = 240 to 300): 44 - 41 = 3 °C.
Since 8 °C > 3 °C, the results support the suggestion. The rate is indeed greater at the start.
Key Takeaways
To investigate a changing rate, look at the change in the dependent variable over equal intervals of the independent variable at different points in the data.
Common Mistakes
Comparing total temperature increase instead of the increase over equal time intervals, or using values from the wrong time periods.
Things to Be Careful About
The justification must use correct values from the table for the same time period (60 s intervals). The statement must clearly be YES or NO.
State two variables that are controlled in this experiment so that the comparison between the absorbing properties of white and black surfaces is valid.
controlled variable 1 ______
controlled variable 2 ______
Answer
- Same distance between the card and the lamp filament.
- Same brightness / power / current / voltage of the lamp. (Other valid answers: same area / material / size of card, same initial / room temperature, same total time, same height of thermometer above the bench).
Same distance from the lamp; same lamp brightness or power.
Walkthrough
To ensure a fair comparison between the white and black cards, any variable that could affect the amount of thermal radiation reaching the card or the rate of temperature rise must be kept constant. The distance determines the intensity of radiation (inverse square law, though not calculated at this level, a closer lamp means more radiation). The lamp's power or current determines how much radiation is emitted. The card's area, thickness, and material affect how much thermal energy is needed to raise its temperature. The initial temperature affects the rate of heat loss to the surroundings.
Key Takeaways
In a fair test, only the independent variable (colour of the card) and the dependent variable (temperature) should change. All other relevant factors must be controlled.
Common Mistakes
Suggesting 'same time' as a control without realising it's the same experiment duration, or saying 'same colour' which is the independent variable. Avoid vague answers like 'be more careful'.
Things to Be Careful About
The mark scheme accepts a wide range of valid controlled variables. Ensure the variable genuinely affects the outcome being measured. For example, 'same room temperature' is valid because it affects heat loss, but 'same student' is not.
A student uses a balancing method to determine the mass of a metre rule.
The student:
- places the metre rule on a pivot
- places a mass on the metre rule with its centre at the 5.0 cm mark
- adjusts the position of the metre rule on the pivot until the metre rule is as close to balance as possible.
Fig. 3.1 shows the balanced metre rule.
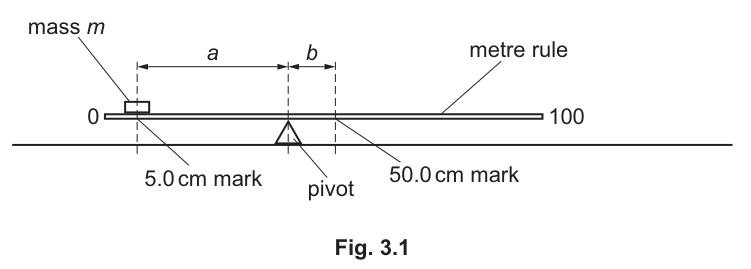
Fig. 3.2 shows the position of the pivot under the metre rule when the metre rule is balanced.
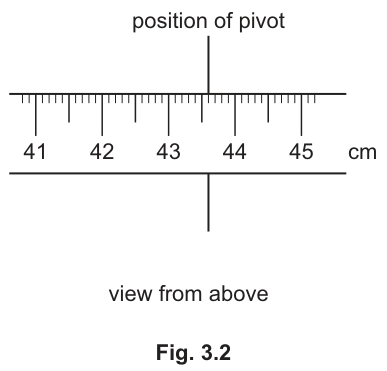
Read the position of the pivot on the metre rule when the metre rule is balanced.
Record the reading in centimetres to the nearest millimetre in Table 3.1 on page 10.
Answer
43.6 cm
Walkthrough
Looking at Fig. 3.2, the pointer indicating the position of the pivot aligns with the 6th small millimetre division past the mark. Therefore, the scale reading to the nearest millimetre is .
Key Takeaways
- On a standard metric rule, each small subdivision is .
- Readings must always be recorded to the precision permitted by the instrument.
Common Mistakes
- Miscounting the millimeter subdivisions (e.g. recording or ).
Things to Be Careful About
- Ensure the reading includes one decimal place when given in centimetres.
Calculate and record, in Table 3.1 on page 10:
1 the distance between the 5.0 cm mark and the pivot
2 the distance between the pivot and the 50.0 cm mark.
Working
Answer
,
a = 38.6 cm, b = 6.4 cm
Walkthrough
- Distance is the distance between the mark and the pivot position ():
- Distance is the distance between the pivot position () and the mark:
Key Takeaways
- Distance between two positions on a scale is the absolute difference between their readings.
Common Mistakes
- Subtracting in reverse or forgetting to subtract from for distance .
Things to Be Careful About
- Keep consistent precision to 1 decimal place matching the table data.
The student repeats the procedure in (a) for , , and .
The results are shown in Table 3.1.
Describe how the student makes sure that the centre of each mass placed on the metre rule is directly above the 5.0 cm mark.
Table 3.1
| 20 | ______ | ______ | ______ | ______ |
| 40 | 38.1 | 33.1 | 11.9 | 0.36 |
| 60 | 34.7 | 29.7 | 15.3 | 0.52 |
| 80 | 31.2 | 26.2 | 18.8 | 0.72 |
| 100 | 29.2 | 24.2 | 20.8 | 0.86 |
Answer
Look through the slot/hole in the mass and align it directly with the mark on the rule.
Look through the slot in the mass and align it with the 5.0 cm mark (or take scale readings at both edges and find the mean)
Walkthrough
Because the slotted mass has a finite width, placing its centre precisely over a single line can be tricky. Accepted practical methods include:
- Looking directly down through the central slot/hole to align it with the line.
- Reading the positions of the left and right edges on the ruler and checking that their average (midpoint) is .
- Measuring the width/diameter of the mass with a ruler or calipers, then positioning the edges at and .
Key Takeaways
- Symmetrical objects have their centre of mass at their geometric centre.
- Edge readings averaged together give the position of the centre.
Common Mistakes
- Vaguely stating "look from above" without explaining how the centre itself is aligned.
Things to Be Careful About
- Be specific about the visual cue or measurement used.
Calculate the ratio for .
Record, in Table 3.1, your answer to two significant figures.
Working
Rounding to two significant figures gives:
Answer
0.17
Walkthrough
Using the values calculated in part (a)(ii):
Compute the ratio:
The question specifies two significant figures. The first two non-zero digits are 1 and 6, followed by 5, which rounds up to:
Key Takeaways
- Leading zeros are not significant.
- The requested number of significant figures must be strictly applied.
Common Mistakes
- Writing (three significant figures) or (one significant figure).
- Confusing significant figures with decimal places.
Things to Be Careful About
- Check if error-carried-forward values from (a)(ii) apply if an earlier mistake was made.
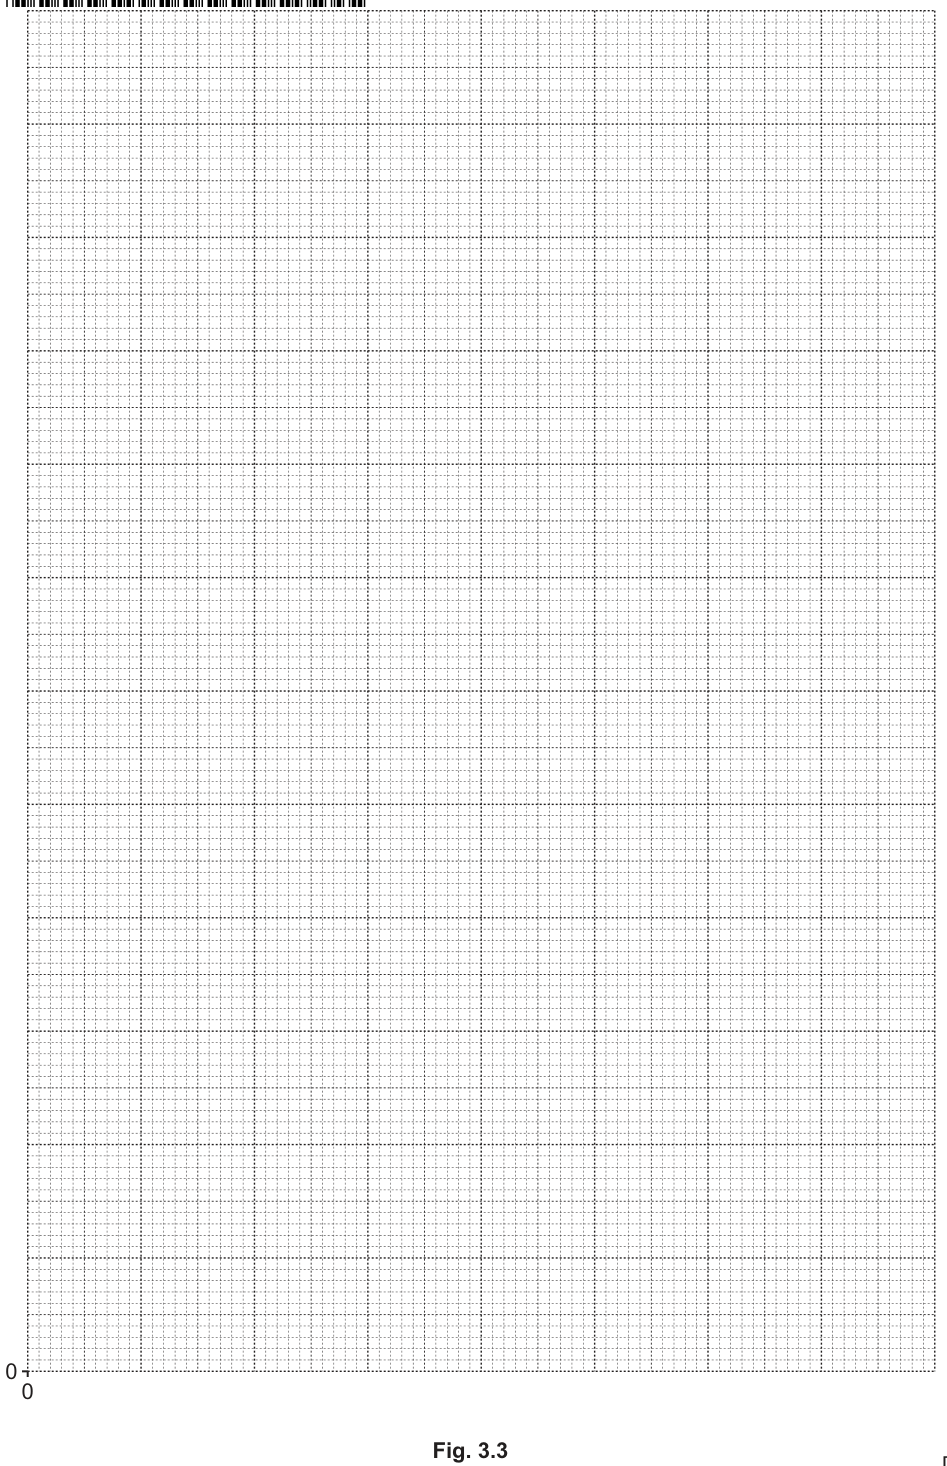
On the grid provided in Fig. 3.3 on page 11, plot a graph of on the -axis against on the -axis.
Start from the origin (0, 0).
Draw the straight line of best fit.
Answer
Plot the graph with the following steps:
- Label the vertical -axis as '' (no unit) and the horizontal -axis as ''.
- Choose sensible, linear scales starting from :
- -axis: to (e.g. or ).
- -axis: to (e.g. ).
- Plot the data points accurately to within half a small square:
- Draw a single, thin, straight line of best fit balancing the points evenly.
Straight-line graph of r against m/g plotted with best-fit line through or near the origin
Walkthrough
To achieve all 4 marks on the graph:
- Axes and Labels:
- -axis: (dimensionless/no unit).
- -axis: or .
- Scales: Both scales must start at as instructed, be linear (equal intervals represent equal amounts), avoid awkward multiples (like 3 or 7), and occupy more than half of the grid in both directions.
- Plotting: Plot all points precisely using small crosses '' or small encircled dots ''. All points must be within of a small square.
- Best-fit line: Draw a single, sharp, continuous straight line that balances the points (an equal distribution of points above and below the line).
Key Takeaways
- Always include units in axis headers where applicable (e.g. ). Ratio has no unit.
- Use more than half the grid along both axes.
Common Mistakes
- Inverting the axes ( on and on ).
- Using non-linear scale increments.
- "Point-to-point" zigzag lines instead of a single best-fit straight line.
- Drawing a thick or "fuzzy" line.
Things to Be Careful About
- Ensure the origin is included as specified in the prompt.
Calculate the gradient of your graph.
Show clearly on the graph how you obtained the numbers you use for your calculation.
= ______
Working
Using coordinates from the line of best fit spanning more than half the line (e.g. and ):
Answer
0.0087 (in range 0.008 - 0.010)
Walkthrough
To find the gradient of the best-fit line:
- Choose two widely spaced points on the line of best fit (not necessarily data points). The horizontal distance between the chosen points must satisfy (more than half the range).
- Clearly draw a large triangle on the graph grid or mark the coordinate read-offs.
- Compute the gradient using:
- For a typical best-fit line, falls in the range to .
Key Takeaways
- Never compute a gradient using a single data point from the table; always read points directly off the drawn line of best fit.
- Use a large triangle covering at least half the length of the drawn line.
Common Mistakes
- Using a very small triangle.
- Calculating instead of .
- Using plotted points that do not lie on the best-fit line.
Things to Be Careful About
- Ensure no unit is assigned to , or if given, it should be .
The mass of the metre rule in grams is given by the equation:
Determine the mass of the metre rule to the nearest gram.
= ______
Working
Rounding to the nearest gram:
Answer
115 g
Walkthrough
Using the formula provided:
Substitute the value of obtained in part (e)(i) (e.g. ):
Rounding to the nearest whole gram gives . (Values typically range between and depending on the candidate's line).
Key Takeaways
- Mass of a standard wooden metre rule is typically around to .
Common Mistakes
- Forgetting to round to the nearest whole gram as explicitly instructed.
Things to Be Careful About
- Ensure correct error-carried-forward computation from the candidate's value of .
Name a piece of apparatus that the student can use to measure the mass of the metre rule directly.
Answer
Top-pan balance (or balance / electronic balance)
top-pan balance
Walkthrough
Mass is measured directly in the laboratory using a balance (e.g. a top-pan balance, electronic balance, or beam balance).
Key Takeaways
- Mass is measured using a balance, whereas weight (force) is measured using a newton meter / spring balance.
Common Mistakes
- Writing "spring balance" or "newton meter" (which measure force/weight, not mass directly).
- Writing "scale" or "weighing scale" without specifying balance.
Things to Be Careful About
- Use accepted scientific terms like "balance" or "top-pan balance".
A student says that the centre of mass of the metre rule is at the 50.0 cm mark.
Describe how you use the apparatus provided to check that this statement is correct.
Answer
Place the metre rule on the pivot at the mark (without any added masses) and check if it balances horizontally.
Check to see if the rule balances when the pivot is placed at the 50.0 cm mark (with no added masses)
Walkthrough
The centre of mass of a uniform object is the point through which its entire weight appears to act. If the pivot is placed directly beneath the centre of mass, the clockwise and anticlockwise moments due to the rule's own weight are zero, so the rule will balance horizontally without any external load.
To check this:
- Remove all added masses.
- Place the pivot exactly at the mark.
- Observe whether the metre rule balances in a horizontal position.
Key Takeaways
- An unsupported body balances on a knife-edge/pivot when the pivot is directly below its centre of mass.
Common Mistakes
- Suggesting adding weights or balancing it at different positions.
Things to Be Careful About
- Specify that the pivot is placed at the mark and that no additional masses are attached.
A student investigates the rate of cooling of hot water in a beaker.
Plan an experiment to investigate the relationship between the thickness of the cardboard insulation wrapped around the beaker and the rate of cooling of the hot water in the beaker.
The apparatus available includes:
- a supply of hot water
- a beaker
- a thermometer
- a supply of 1 mm thick cardboard sheets
In your plan include:
- any other apparatus needed
- a brief description of the method, including what you will measure and how you make sure that your measurements are accurate
- the variables you will control
- a results table to record your measurements (you are not required to enter any readings in the table)
- how you will process your results to reach a conclusion.
Additional apparatus
- stopwatch / stopclock / timer
- measuring cylinder (to measure the volume of water)
- rubber band or tape (to hold the cardboard in place)
Method
- Wrap the beaker with a chosen number of 1 mm cardboard sheets (e.g. 0, 2, 4 and 6 sheets) and hold them in place with a rubber band.
- Measure 200 cm³ of hot water with the measuring cylinder and pour it into the beaker.
- Place the thermometer in the water. When the temperature reaches 80 °C, start the stopwatch.
- Stir the water gently and record the time taken for the temperature to fall to 60 °C.
- Repeat the timing twice for each thickness and calculate the average time.
- Repeat the whole procedure for each different thickness of cardboard.
Variables to control
- same initial temperature of the hot water (80 °C)
- same volume / mass of hot water (200 cm³)
- same final temperature / same range of temperatures (80 °C to 60 °C)
- same beaker and thermometer, and same surrounding conditions
Results table
| Number of cardboard sheets | Thickness / mm | Initial temperature / °C | Final temperature / °C | Time taken / s | Average time / s |
|---|---|---|---|---|---|
| 0 | 0 | 80 | 60 | ||
| 2 | 2 | 80 | 60 | ||
| 4 | 4 | 80 | 60 | ||
| 6 | 6 | 80 | 60 |
Processing and conclusion
For each thickness, calculate the rate of cooling:
Plot a graph of rate of cooling against thickness (or number of sheets) of cardboard. If the rate of cooling decreases as the thickness increases, this shows that thicker insulation reduces the rate of cooling.
Plan: time the cooling of equal volumes of hot water over the same temperature range for different numbers of cardboard sheets; control initial temperature, volume and temperature range; tabulate thickness, temperatures and time; plot rate of cooling against thickness to conclude.
Walkthrough
This is a planning question, so the marks are for the separate parts of a complete plan. The independent variable is the thickness of cardboard (or number of sheets), and the dependent variable is the rate of cooling, which we can measure as the time taken for the water to cool through a fixed temperature drop.
First, identify the extra apparatus: a stopwatch/stopclock/timer is needed to measure time. A measuring cylinder helps to control the volume of water, and a rubber band holds the cardboard in place.
The method must include at least two different thicknesses of cardboard (e.g. 0, 2, 4 and 6 sheets). For each thickness, add the same volume of hot water, start timing when the water reaches a chosen initial temperature, and record the time for it to fall to a chosen final temperature. Repeating and averaging makes the timing more accurate.
Control variables are essential for a fair test: same initial temperature, same volume/mass of water, same final temperature (or same range of temperatures), and same beaker/thermometer/room conditions. If these change, you cannot tell whether the thickness caused the difference.
The results table must include the thickness or number of sheets, the temperatures, and the time, all with units.
Finally, process the results by calculating rate of cooling = temperature drop ÷ time. Plot a graph of rate of cooling against thickness. If the rate decreases as thickness increases, thicker insulation reduces the rate of cooling.
Key Takeaways
- A fair test needs controlled variables.
- Rate of cooling is a temperature change per unit time.
- A results table needs headings with units.
- A graph makes the relationship clear.
- The conclusion must link the pattern to the physics: insulation reduces heat loss.
Common Mistakes
- Using only one thickness of cardboard (MP3 requires at least two).
- Not controlling the initial temperature or volume of water.
- Forgetting units in the table (MP5).
- Not repeating readings.
- Saying "thicker insulation cools faster" without data.
- The mark scheme also allows measuring the temperature drop over a fixed time instead of timing a fixed drop; either is fine as long as the same range/time is used.
Things to Be Careful About
- Start timing at the same temperature each time.
- Stir gently so the temperature is uniform.
- Use the same thermometer and beaker.
- Use a sensible number of sheets (e.g. 0, 2, 4, 6) so the trend is visible.
- Quote rate of cooling in °C/s or °C/min.
- If you plot time against thickness instead, a longer time means a slower rate of cooling.