Physics 5054/31 — October/November 2025
Cambridge O-Level · Practical Test · worked solutions for every part, with the mark scheme
Topics Experimental Contexts · Observations and Measurements · Analysis, Conclusions and Evaluation · Use of Techniques, Apparatus and Materials · Planning Experiments and Investigations
In this experiment, you will measure the efficiency of a small electric heater constructed from a coil of wire.
You are provided with a circuit consisting of:
- a power supply
- a coil of wire in a beaker (the coil of wire is the heater)
- an ammeter
- a voltmeter
- a switch in the open position
- connecting wires.
In the answer space, draw a circuit diagram of the circuit that has been set up for you.
Answer
A circuit diagram showing the power supply, ammeter, heater (coil) and switch connected in series, with the voltmeter connected in parallel across the heater.
Series circuit with power supply, ammeter, heater and switch; voltmeter in parallel across the heater
Walkthrough
This part asks you to draw the circuit diagram of the apparatus set up for you. The circuit is a series circuit: the power supply, ammeter, heater (the coil of wire) and switch are all connected one after another in a single loop. The ammeter must be in series because it measures the current flowing through the circuit, and the same current flows through every component in a series circuit. The switch can be drawn open or closed — the mark scheme accepts either.
The voltmeter is different: it measures the potential difference (p.d.) across the heater, so it must be connected in parallel across the heater, with one wire to each terminal of the heater. A voltmeter has a very high resistance, so putting it in series would block the current.
The mark scheme gives one mark for the series loop (power supply, heater, ammeter, switch) and one mark for the voltmeter in parallel across the heater.
Key Takeaways
- An ammeter is always connected in series.
- A voltmeter is always connected in parallel across the component whose p.d. is being measured.
- You must be able to draw and label standard circuit symbols.
Common Mistakes
- Putting the voltmeter in series — it would have a very high resistance and stop the current.
- Putting the ammeter in parallel — it has very low resistance and would short-circuit the power supply.
- Forgetting the switch.
Things to Be Careful About
- The voltmeter must be across the heater (or the power supply) specifically, not across the ammeter.
- Draw the components with correct circuit symbols and label them.
You are also provided with:
- a thermometer
- a stirrer
- a supply of water at room temperature
- a measuring cylinder
- a stopwatch.
Use the measuring cylinder to measure 50 of water.
Pour the water into the beaker containing the heater.
Make sure that the water covers the heater.
Measure and record the initial temperature of the water in the beaker.
= ______
Answer
(candidate's own reading; any sensible room-temperature value is accepted)
Sensible water temperature, e.g. 25.0 °C
Walkthrough
You measure 50 cm³ of water with the measuring cylinder, pour it into the beaker so the heater is covered, and record the initial temperature with the thermometer. Since this is a practical paper, the exact value depends on your reading — the mark scheme accepts any sensible water temperature (a room-temperature value, typically around 20–30 °C).
Record the temperature to the precision of the thermometer scale — usually 0.1 °C or 0.5 °C depending on the instrument. Include the unit °C.
Key Takeaways
- Readings must be recorded to the precision the instrument allows.
- Every recorded value needs its unit.
Common Mistakes
- Recording the temperature without a unit.
- Recording a value with more digits than the scale allows (e.g. 25.37 °C from a thermometer marked in 1 °C divisions).
Things to Be Careful About
- Read the thermometer at eye level to avoid parallax error.
- Make sure the water covers the heater before taking the reading.
Close the switch, and start the stopwatch immediately.
Record the current in the circuit and the potential difference across the heater.
= ______
= ______
Answer
(candidate's reading, recorded to 0.01 A or better)
(candidate's reading, recorded to 0.1 V or better)
I = 1.30 A (to 0.01 A), V = 3.0 V (to 0.1 V) — candidate's own readings
Walkthrough
With the switch closed, you read the ammeter and the voltmeter. The mark scheme expects the current recorded to 0.01 A or better (e.g. 1.30 A) and the p.d. recorded to 0.1 V or better (e.g. 3.0 V). These are candidate-dependent readings — typical values for this experiment are around and .
The precision is the key point: the reading must reflect the scale divisions on the instrument.
Key Takeaways
- An ammeter reading is recorded to 0.01 A or better.
- A voltmeter reading is recorded to 0.1 V or better.
Common Mistakes
- Recording the current as 1.3 A instead of 1.30 A — the trailing zero shows the precision.
- Mixing up the units (A for current, V for p.d.).
Things to Be Careful About
- Read the instruments without parallax error.
- Record both readings at the same time, immediately after closing the switch.
Leave the circuit switched on for 5 minutes.
During this time, gently stir the water using the stirrer.
After 5 minutes, open the switch.
Continue to stir the water for a further minute before recording the temperature again. This is the final temperature .
Record and calculate the temperature change .
Use the equation shown.
= ______
= ______
Working
Answer
, (candidate's own readings; )
θF = 29.5 °C, Δθ = 4.5 °C (candidate's own readings; θF ≥ θ0)
Walkthrough
After 5 minutes of heating (with gentle stirring) you open the switch, stir for a further minute, and record the final temperature . The final temperature must be greater than or equal to the initial temperature (the water has been heated). Then you calculate the temperature change:
For example, if and , then .
The mark is for recording (with ) and recording .
Key Takeaways
- Temperature change is final minus initial.
- The final temperature must be at least the initial temperature — the heater adds energy.
Common Mistakes
- Recording — physically impossible since the heater warms the water.
- Forgetting to calculate .
Things to Be Careful About
- Units: °C.
- Record to the same precision as .
Explain why the water is stirred for a further minute after the circuit is switched off.
Answer
To ensure the water is at a uniform temperature, so that all the heat from the coil is absorbed by the water and the final reading is representative.
To ensure the water is at a uniform temperature / all the heat from the coil is absorbed by the water
Walkthrough
The water is stirred for a further minute after the switch is opened so that the temperature is uniform throughout the beaker. Without stirring, the water near the coil would be hotter than the water at the edges, and the thermometer reading would not represent the average temperature of all the water. Stirring also ensures that all the heat from the coil is transferred to the water (rather than some staying in the coil or in a local hot spot).
The mark scheme accepts either: '(to ensure the water is at) a uniform temperature' or '(to ensure that) all the heat from the coil is absorbed by the water'.
Key Takeaways
- Stirring equalises the temperature so the reading is representative.
- This is a technique for accurate observations.
Common Mistakes
- Saying 'to cool it down' — stirring does not cool the water.
- Saying 'to make the reading more accurate' without saying why (uniform temperature).
Things to Be Careful About
- The mark is for the idea of a uniform temperature, so state it explicitly.
The energy supplied by the heater is given by
where .
Calculate . Show your working.
= ______
Working
Answer
(using the candidate's values of and )
1170 J (using candidate's I and V)
Walkthrough
The energy supplied by the heater is calculated from the electrical power and the time:
where is the current, is the p.d. across the heater, and (5 minutes). Using the example values and :
The mark is for the correct calculation from your own values of and . Show the substitution so the working is visible.
Key Takeaways
- Electrical energy = power × time = .
- Convert minutes to seconds before substituting (5 min = 300 s).
Common Mistakes
- Using instead of .
- Not showing the substitution.
Things to Be Careful About
- The answer is in joules (J).
- Use the candidate's own and values.
The energy gained by the water is given by the equation shown.
Calculate . Show your working.
= ______
Working
Answer
(using the candidate's value of ; must be )
945 J (using candidate's Δθ; must be ≤ Q_H)
Walkthrough
The energy gained by the water is:
Here 50 is the mass of water in grams (50 cm³ of water has a mass of 50 g), 4.2 is the specific heat capacity of water in J/(g °C), and is the temperature rise. Using the example :
The mark scheme also requires — the water cannot gain more energy than the heater supplies, so if your numbers give something is wrong.
Key Takeaways
- with and .
- The energy gained by the water must be less than the energy supplied by the heater.
Common Mistakes
- Getting — physically impossible; check the arithmetic.
- Forgetting the unit (J).
Things to Be Careful About
- The mass is in grams here (50 g), not kg — the equation is set up for grams.
- Use the candidate's own .
The efficiency of the heater is given by the equation shown.
Calculate the efficiency of the heater. Show your working.
efficiency = ______
Working
Answer
0.81 (using candidate's Q_W and Q_H)
Walkthrough
Efficiency is the useful energy output divided by the energy input:
Using the example values:
The efficiency is a ratio with no unit. It can also be expressed as a percentage (81%).
Key Takeaways
- Efficiency = useful output energy / total input energy.
- Efficiency is dimensionless (or given as a percentage).
Common Mistakes
- Inverting the ratio () — efficiency must be less than 1.
- Giving the answer as a percentage without the % sign, or as a decimal without explanation.
Things to Be Careful About
- Use the candidate's own and values.
- The efficiency must be between 0 and 1 (or 0% and 100%).
Suggest one change that can be made to the apparatus you have used in this investigation that will increase the efficiency of the heater.
Answer
Insulate the beaker (or add a lid) so that less heat is lost to the surroundings.
Insulate the beaker / add a lid
Walkthrough
The efficiency is low because some of the energy supplied by the heater is lost to the surroundings instead of heating the water. To increase the efficiency, reduce that loss — for example, insulate the beaker or add a lid. The mark scheme accepts 'insulate / add a lid to the beaker'.
Key Takeaways
- Efficiency improves when less energy is wasted.
- Insulation reduces heat loss to the surroundings.
Common Mistakes
- Suggesting 'use a bigger heater' — that would supply more energy but not change the efficiency.
- 'Stir more' — stirring is already part of the method and does not change the efficiency.
Things to Be Careful About
- The change must reduce energy loss to the surroundings, so insulation or a lid is the expected answer.
You will investigate the refraction of light through a transparent block.
You are provided with:
- a rectangular transparent block
- an illuminated slit
- a protractor
- a 30 cm ruler.
Fig. 2.1 is on page 7.
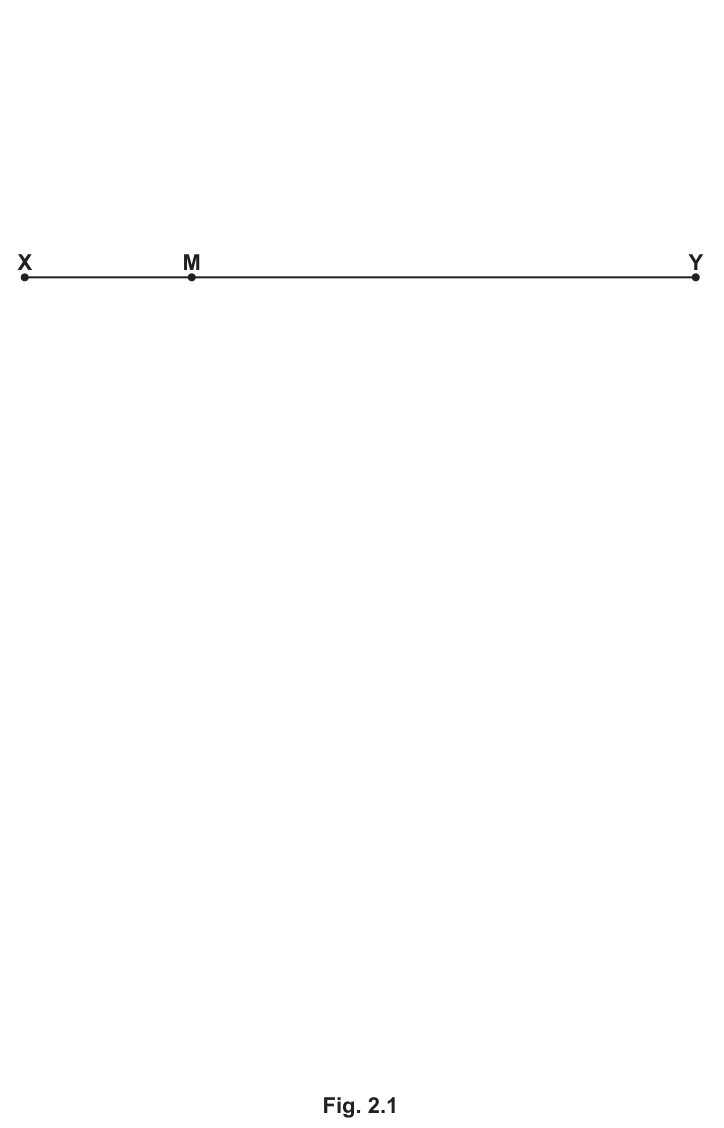
On Fig. 2.1, draw a normal to the line XY at point M. Extend the normal 8 cm above and 8 cm below the line XY.
Answer
A straight line drawn perpendicular to line passing through point , extending above line and below line .
Straight line drawn perpendicular to XY at M, extending 8 cm above and 8 cm below XY
Walkthrough
Using a protractor, align the baseline along the line with the centre mark at point . Make a mark at . Using a ruler, draw a continuous straight line through point that extends above and below . This line is the normal to the boundary.
Key Takeaways
- A normal line is always perpendicular () to the boundary surface.
- Exact lengths specified in experimental instructions must be followed carefully using a ruler.
Common Mistakes
- Drawing the normal not strictly at to the line .
- Forgetting to extend the line both above and below line .
Things to Be Careful About
- Ensure the line is drawn thinly and sharply with a sharp pencil.
On Fig. 2.1, draw a line from point M to the left of the normal above line XY so that the angle between the drawn line and the normal is .
Label the top left-hand end of the line as point L.
Answer
A straight line drawn from point to the left of the normal in the region above line , making an angle of with the normal, with the top left-hand end labelled .
Line LM drawn to the left of the normal at an angle of 40° to the normal and labelled L
Walkthrough
Place the protractor on the normal line with its centre at point . Measure an angle of to the left of the normal (in the upper half above ). Mark this angle and draw a straight line from through the mark. Label the top-left end of this line . This represents the incident ray with an angle of incidence .
Key Takeaways
- The angle of incidence is always measured between the incident ray and the normal, NOT between the incident ray and the surface.
Common Mistakes
- Measuring from the line instead of from the normal.
- Drawing the line to the right of the normal instead of to the left.
Things to Be Careful About
- Keep pencil lines sharp and align the protractor accurately with the normal line.
Place the block with one of its long sides on the line XY.
The top left-hand side of the block should be at point X.
Draw the outline of the block on Fig. 2.1.
Do not remove the transparent block.
Answer
A rectangle drawn representing the outline of the transparent block, with one long side along line and the top left corner aligned at point .
Rectangular outline of block drawn on Fig. 2.1 with top left corner at point X
Walkthrough
Place the transparent rectangular block onto the paper so that its top long edge aligns exactly with the line and its top left corner touches point . Hold the block firmly so it does not slip, and carefully draw around its other three edges with a pencil.
Key Takeaways
- Accurately outlining an optical component is essential so that if it shifts, it can be repositioned correctly.
Common Mistakes
- Allowing the block to shift while tracing around it.
Things to Be Careful About
- Ensure the pencil is held vertically against the edges of the block to trace its exact boundaries.
Using the illuminated slit, shine a narrow ray of light along the line LM.
Mark with small crosses (x) two points on the ray that emerges from the block.
Choose the position of the points so that the ray leaving the block can be drawn accurately.
Answer
Two small crosses (x) marked along the centre of the emergent ray of light below the block (to the right of the normal), placed at least apart from each other.
Two crosses marked on the emergent ray below the block, spaced at least 5 cm apart
Walkthrough
Align the light box slit so a narrow ray shines along the incident line into the block at . The ray refracts inside the block and emerges from the opposite face below . Observe the emergent ray on the paper. Mark two precise crosses along the middle of this beam, ensuring they are spaced well apart (at least apart) to minimise alignment errors when joining them later.
Key Takeaways
- Spacing marking points / pins as far apart as possible significantly improves the angular accuracy of the drawn ray line.
Common Mistakes
- Placing the two crosses too close together (less than apart), which increases angular inaccuracy.
- Marking the crosses off-centre of the light beam.
Things to Be Careful About
- Keep the room reasonably dark or shield the light to see the centre of the beam clearly.
Remove the glass block.
Join the marked crosses and extend the line to meet the lower end of the outline of the block.
Label the point where the line meets the block outline as point P.
Answer
A straight line drawn through the two marked crosses and extended upwards to meet the bottom boundary line of the block outline, with the intersection point labelled .
Straight line drawn through the crosses to the bottom edge of the block, labelled point P
Walkthrough
Remove the transparent block. Use a ruler to draw a straight line connecting both crosses and extend this line back to intersect the lower horizontal line of the rectangular outline. Label this intersection point . Point represents the point where the light ray emerged from the block.
Key Takeaways
- Extending the emergent ray backwards gives the exact point of exit from the optical medium.
Common Mistakes
- Forgetting to extend the line all the way to the boundary of the block.
- Forgetting to label the intersection point .
Things to Be Careful About
- Ensure the straight line passes through the centres of both crosses precisely.
Answer
A straight line drawn inside the block outline connecting point on the top edge to point on the bottom edge.
Straight line drawn connecting points M and P inside the block outline
Walkthrough
Using a straight ruler, draw a single line from point (where the incident ray enters the block) to point (where the ray leaves the block). This line represents the path of the refracted ray inside the transparent block.
Key Takeaways
- Light travels in straight lines within a uniform, homogeneous medium such as glass or Perspex.
Common Mistakes
- Drawing a curved or wobbly line instead of a clean, straight ruler line.
Things to Be Careful About
- Line must start exactly at and end exactly at .
The angle of refraction is the angle between the line MP and the normal drawn in (a)(i).
Measure and record angle .
= ______
Working
Measure the angle between the refracted ray and the lower section of the normal line drawn at .
Answer
25°
Walkthrough
Place the centre of the protractor at point , aligning the baseline of the protractor with the normal line extending below line . Read the angle between this normal and the line . For a typical glass or acrylic block with and an angle of incidence , the angle of refraction is approximately (values in the range to are accepted).
Key Takeaways
- The angle of refraction is always measured between the refracted ray inside the medium and the normal.
Common Mistakes
- Measuring the angle between line and the surface instead of the normal.
- Misreading the inner/outer scale of the protractor.
Things to Be Careful About
- Ensure the protractor is centred accurately at point .
The refractive index of the transparent block is given by the equation shown.
Calculate and give your answer to 2 significant figures.
= ______
Working
Using the measured value :
Rounding to 2 significant figures:
Answer
1.5
Walkthrough
- State the given formula for refractive index:
- Substitute the measured value of (e.g. ):
- Round the final value to 2 significant figures as requested by the question, giving (values in the range to based on the candidate's are accepted).
Key Takeaways
- Refractive index is a dimensionless ratio (it has no units).
- Follow significant figure requirements stated in the question.
Common Mistakes
- Having the calculator in radian mode instead of degree mode.
- Giving the answer to more or fewer than 2 significant figures (e.g. writing instead of ).
- Adding a unit to refractive index.
Things to Be Careful About
- Ensure the calculator is set to DEGREES (D) mode before computing trigonometric functions.
Suggest how you could change the experiment to make sure that your value of is accurate.
Answer
Repeat the experiment for several different angles of incidence, calculate the refractive index for each, and find the mean value of .
Repeat for different angles of incidence and find a mean value of n
Walkthrough
To increase the accuracy and reliability of the refractive index determination, one can:
- Repeat the procedure using a range of different angles of incidence (such as , , , ), compute for each trial, and calculate an average (mean) value, or plot a graph of against .
- Alternatively, use a narrower beam of light or draw lines with a sharper, thinner pencil to reduce uncertainty in locating the exact centre of the ray.
Key Takeaways
- Repeating measurements across different values of the independent variable reduces random errors and improves the accuracy of a derived constant.
- Reducing line thickness and ray width reduces experimental uncertainty in optics experiments.
Common Mistakes
- Giving vague answers such as "be more careful", "use a better ruler", or "do it in a dark room" without linking to the measurement of .
Things to Be Careful About
- When suggesting repeats, specify what is being varied (different angles of incidence) and what is done with the results (calculate a mean).
You will measure the average mass of a marble (glass ball) and investigate the speed of a marble rolling down a slope.
You are provided with:
- a small dish
- 5 identical marbles (glass balls)
- access to a top pan balance.
Empty the dish and place it on the top pan balance.
Press the zero (tare) button.
Add the 5 marbles back to the dish.
Write down the mass of the 5 marbles.
mass of 5 marbles = ______
Answer
25.0 g
Walkthrough
The top pan balance is tared (zeroed) with the empty dish placed on it. Adding 5 identical marbles allows the candidate to measure their combined mass directly. A typical set of 5 glass marbles has a mass in the range of to ().
Key Takeaways
- Taring the balance subtracts the mass of the container (the dish), giving directly the mass of the marbles alone.
Common Mistakes
- Forgetting to tare the balance before adding the marbles, which results in including the mass of the dish.
Things to Be Careful About
- Ensure the reading is recorded to the precision shown on the balance (typically 1 or 2 decimal places).
Working
Answer
5.0 g
Walkthrough
To find the average mass of a single marble, divide the measured mass of the 5 marbles from part (a)(i) by 5:
For a measured value of , the average mass is .
Key Takeaways
- Measuring multiple items together and dividing by the count reduces the relative uncertainty of a single measurement.
Common Mistakes
- Arithmetic errors in dividing by 5.
Things to Be Careful About
- Keep significant figures consistent with the mass recorded in (a)(i).
You are also provided with:
- a clamp, stand and boss
- 2 metre rules or wooden strips, arranged as shown in the diagram with a small gap between them to act as a track (ramp) for a marble
- a small block of wood to act as a stopper at the end of the track
- a stopwatch
- an additional metre or half-metre rule, or a 30 cm ruler.
The apparatus has been set up for you as shown in Fig. 3.1.
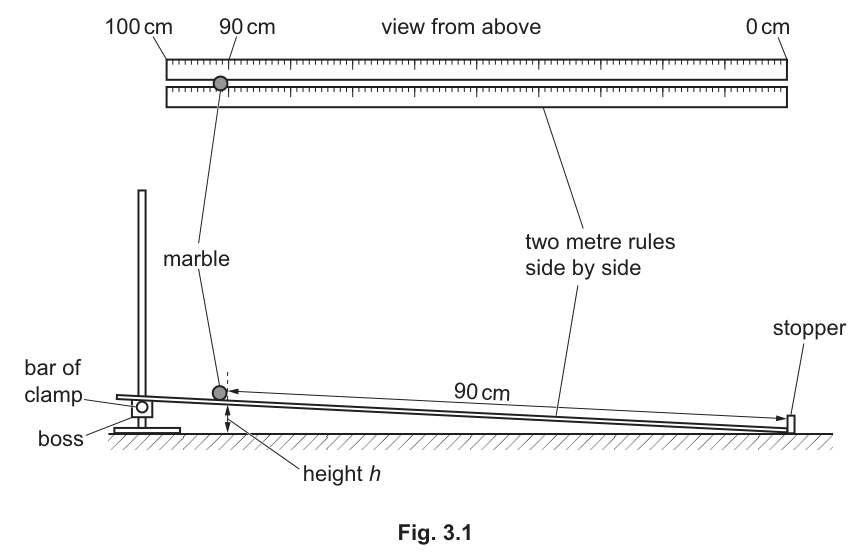
The distance between the bench and the bottom side of the rule at the 90 cm mark is .
The ramp is initially arranged with height above the bench.
Place one marble on the gap between the rules so that its right-hand edge is on the 90.0 cm mark as shown.
Release the marble, and record the time for it to roll down the ramp until it hits the stopper.
Repeat the experiment two more times, recording the results as times and .
Calculate the average time for the marble to travel 90.0 cm down the ramp.
= ______
= ______
= ______
= ______
Working
Example values:
Answer
t_1 = 2.85 s, t_2 = 2.81 s, t_3 = 2.86 s, t_av = 2.84 s
Walkthrough
- The marble is released from rest with its right-hand edge at the mark on the track set at height .
- The stopwatch is started on release and stopped when the marble hits the stopper at the bottom ( mark).
- Three separate trials are timed to obtain , , and .
- The average time is calculated using:
Key Takeaways
- Repeating measurements and calculating the mean minimizes the effect of random timing and human reaction-time errors.
Common Mistakes
- Rounding the average incorrectly or omitting one of the three readings when calculating the mean.
Things to Be Careful About
- Ensure all individual times and the average are recorded to a consistent precision (typically 2 decimal places for digital stopwatches, or 1 decimal place if taking reaction time into account).
Repeat the experiment in (b)(i) for heights , , and .
The ramp height is adjusted using the clamp, boss and stand.
Record all your results in Table 3.1, including your results from (b)(i).
Table 3.1
| 4.0 | ||||
| 6.0 | ||||
| 8.0 | ||||
| 10.0 | ||||
| 12.0 |
Answer
Representative completed table:
| 4.0 | 2.85 | 2.81 | 2.86 | 2.84 |
| 6.0 | 2.32 | 2.28 | 2.30 | 2.30 |
| 8.0 | 2.01 | 1.97 | 2.02 | 2.00 |
| 10.0 | 1.80 | 1.78 | 1.76 | 1.78 |
| 12.0 | 1.63 | 1.61 | 1.65 | 1.63 |
Complete table with all repeat times recorded and correctly calculated average times decreasing as h increases
Walkthrough
- For each height , the marble is released from the mark three times.
- All three trials () are entered in Table 3.1.
- The average time is computed for each row: .
- As the height increases, the slope becomes steeper, so the acceleration of the marble increases and the transit time decreases down the table.
Key Takeaways
- Increasing ramp height increases the component of gravitational force along the slope, resulting in greater acceleration and shorter rolling times.
Common Mistakes
- Inconsistent decimal places down a single column.
- Arithmetic mistakes when calculating row averages.
Things to Be Careful About
- Ensure the trend shows decreasing steadily as increases.
On the grid provided in Fig. 3.2 on page 13, plot a graph of on the y-axis against on the x-axis.
Draw a line of best fit through your points. You do not need to start your axes at (0, 0).
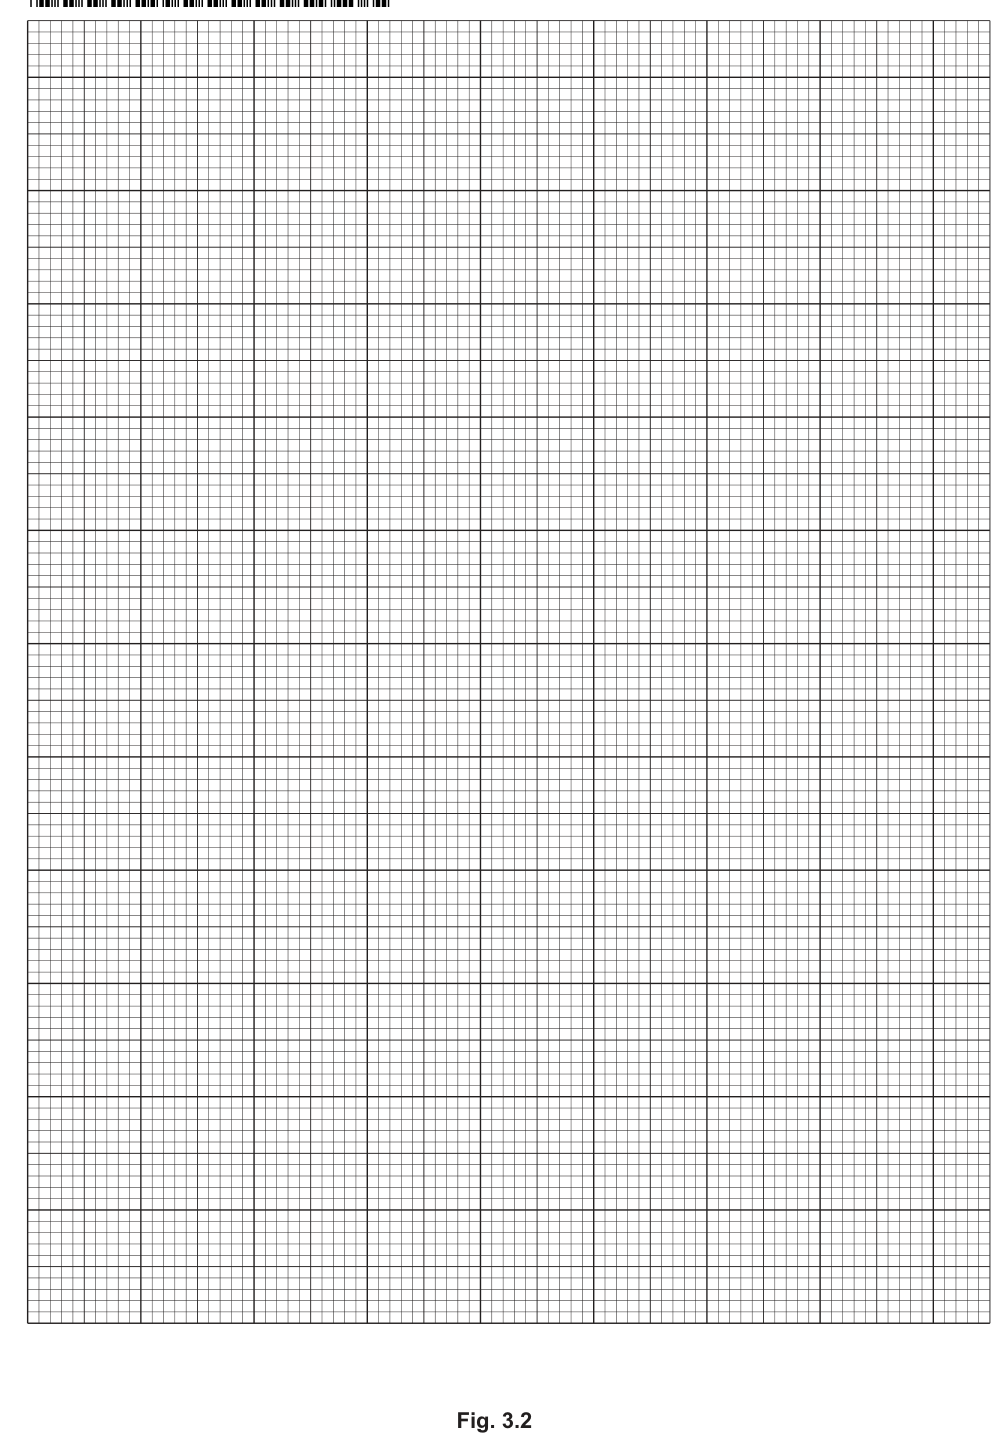
Answer
Plot the graph following these requirements:
- Axes: Vertical axis labelled '' and horizontal axis labelled ''.
- Scales: Sensible linear scales where points occupy more than half the grid in both directions (e.g. -axis spanning to , -axis spanning to ).
- Plotting: All 5 points plotted accurately to within small square.
- Best-fit line: A single, thin, smooth line or curve of best fit drawn cleanly through the plotted points.
Graph of t_av / s against h / cm plotted with labelled axes, linear scales, accurately plotted points, and a thin best-fit line
Walkthrough
- Label Axes: Label the -axis with '' and the -axis with ''.
- Choose Scales: Select linear, easy-to-read scale divisions (e.g., 2 cm per large block on the x-axis, 0.2 s per large block on the y-axis). The data points must occupy at least half of the grid in both directions.
- Plot Points: Mark each pair of values with a small, sharp cross ( or ) or a small dot with a circle around it. Points must be plotted to within half a small grid square.
- Line of Best Fit: Draw a thin, smooth best-fit line (or smooth curve) showing the downward trend, balancing points evenly on either side of the line without forcing it through (0,0).
Key Takeaways
- Good graph-plotting technique requires clear axis labels with units, non-awkward linear scales covering of the grid, precise plotting, and a smooth, unforced line of best fit.
Common Mistakes
- Using awkward scales such as multiples of 3 or 7, which makes plotting difficult and loses scale marks.
- Drawing thick, 'fuzzy', or multi-stroke lines.
Things to Be Careful About
- The question explicitly notes: 'You do not need to start your axes at (0, 0)', allowing candidates to choose a false origin for the y-axis to spread the points across the grid.
Answer
As height increases, the average time decreases (or is inversely related to ).
As h increases, t_av decreases
Walkthrough
From the experimental data and the plotted graph, as the ramp height increases, the time taken for the marble to roll down the slope becomes shorter. Therefore, as increases, decreases.
Key Takeaways
- Stating a relationship requires describing how changes in the independent variable () cause changes in the dependent variable ().
Common Mistakes
- Stating 'they are inversely proportional' without mathematical justification (such as testing ). Simply stating 'as increases, decreases' is safe and fully credited.
Things to Be Careful About
- Ensure both variables ( and ) are mentioned explicitly.
Working
From the graph, draw a vertical line from up to the best-fit line, then a horizontal line to the -axis to read .
Example reading from graph:
Answer
2.14 s
Walkthrough
- Locate on the horizontal axis of Fig. 3.2.
- Draw a dashed vertical construction line up from until it intersects the line of best fit.
- From this intersection point, draw a dashed horizontal line across to the vertical () axis.
- Read off the value of from the scale (e.g. ).
Key Takeaways
- When asked to 'show on the graph how you find the value', visible construction/tie lines must be drawn on the grid.
Common Mistakes
- Forgetting to draw the construction lines on the graph grid, which loses 1 mark.
Things to Be Careful About
- Read the scale division carefully to ensure the interpolated time matches the scale precision.
The average speed of the marble is given by
where is the distance the ball travels along the track.
Find the average speed of the marble when . Give the unit of your answer.
average speed = ______ unit ______
Working
Distance travelled .
Using the candidate's value of :
or in :
Answer
(or )
42.1 cm/s
Walkthrough
- The distance travelled by the marble along the track is (or ).
- Using the equation provided:
- Substitute and the value of obtained from (c)(i):
- If using : .
- If using : .
- State the numerical value and the matching unit ( or ).
Key Takeaways
- Average speed is the total distance divided by the total time taken ().
- The unit must match the unit used for distance and time.
Common Mistakes
- Giving the unit as while using without converting to metres.
- Omitting the unit on the unit blank line.
Things to Be Careful About
- Round the final speed to 2 or 3 significant figures.
A solar cell is a device that can generate electrical power when light falls on it.
You are given a solar cell connected to a fixed resistor as in the incomplete circuit shown in Fig. 4.1.
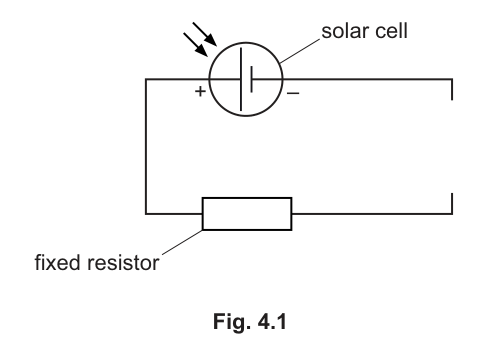
Plan an experiment to investigate how the brightness of the light falling on the solar cell affects the electrical power output of the solar cell.
The power of the cell can be found using the equation shown.
The following apparatus is available in addition to the apparatus shown in the circuit diagram:
- a lamp connected to a power supply
- a metre rule
- a voltmeter
- an ammeter
- connecting leads.
Other apparatus normally available in a school laboratory can also be used.
You are not required to do this experiment.
In your plan, you should:
- explain how you will vary the brightness of the light falling on the solar cell
- show how the voltmeter and ammeter are used. You may draw on Fig. 4.1 to help your explanation
- state any variable(s) that you will control
- draw a table with column headings to show how to display recorded measurements (you are not required to enter any readings in the table)
- explain how to use your measurements to reach a conclusion.
Answer
Method to vary brightness (MP1):
Move the lamp to different distances from the solar cell, using the metre rule to measure and record the distance. Keep the power supply voltage connected to the lamp constant so the lamp's own brightness does not change.
Circuit connections (MP2):
Complete Fig. 4.1 by adding the ammeter in series with the solar cell and fixed resistor, and the voltmeter connected in parallel across either the solar cell or the fixed resistor.
Measurements (MP3):
For at least 5 different distances (e.g. 10 cm, 20 cm, 30 cm, 40 cm, 50 cm), record the current from the ammeter and the voltage from the voltmeter.
Control variables (MP4):
- Keep the voltage of the power supply connected to the lamp constant.
- Keep ambient lighting in the room constant (e.g. close curtains, turn off other lights).
Results table (MP5):
| Distance of lamp from solar cell / cm | Current / A | Voltage / V | Power / W |
|---|---|---|---|
Conclusion (MP6):
Calculate the power for each reading using . Plot a graph of power (y-axis) against distance (x-axis). If the graph shows a clear trend (e.g. power decreases as distance increases), conclude that the brightness of the light affects the power output of the solar cell.
See working above for the full experimental plan covering method, circuit diagram, controls, table, and conclusion.
Walkthrough
- Varying the independent variable (MP1): The brightness of light on a solar cell can be varied by changing the distance between the light source (the lamp) and the solar cell. A metre rule is used to measure and set these distances accurately. Changing the power supply voltage to the lamp is not allowed because the scheme requires controlling the lamp's brightness; distance is the practical way to vary intensity.
- Circuit connections (MP2): To measure power (), we need current and voltage. The ammeter must be in series to measure the current flowing through the circuit. The voltmeter must be in parallel across either the solar cell or the fixed resistor to measure the potential difference.
- Taking readings (MP3): We need a range of data points. Taking readings for at least 5 different distances ensures a valid trend can be established. The scheme requires at least 2 different distances, but a proper plan uses more.
- Control variables (MP4): To ensure a fair test, only the distance should change. The lamp's brightness must not change, so the power supply voltage to the lamp must be fixed. Ambient light must also be controlled to prevent it from affecting the solar cell's output.
- Results table (MP5): The table must record the independent variable (distance) and the raw dependent variables (current, voltage) with correct units. Calculating power is a derived quantity, often added as a column to show how the conclusion is reached.
- Conclusion (MP6): To analyze the data, calculate the power for each pair of current and voltage readings. Plotting a graph of power against distance (or brightness) will reveal the relationship. A bar chart of power against different distance ranges is also acceptable.
Key Takeaways
- Planning an experiment requires addressing the independent variable, measurement method, control variables, data recording, and data analysis.
- Ammeters are always in series; voltmeters are always in parallel.
- Units must be included in table headings as
Quantity / unit. - Power is not directly measured; it must be calculated from current and voltage, so the conclusion must mention calculating power or plotting power.
Common Mistakes
- Forgetting to include units in the table headings (e.g. writing
Currentinstead ofCurrent / A). - Connecting the voltmeter in series or the ammeter in parallel.
- Failing to state a control variable (e.g. saying
keep the same lampis not enough; must specifykeep the voltage of the lamp's power supply constantorkeep ambient lighting constant). - Saying
change the brightness of the lampinstead ofchange the distance of the lamp from the solar cell. - Not calculating power in the conclusion; the question asks about power output, so the analysis must involve power, not just current or voltage.
Things to Be Careful About
- The question states
You are not required to do this experiment, so this is purely a written plan. - When drawing the circuit, ensure the voltmeter is clearly in parallel and the ammeter in series.
- Distance is the independent variable here, not brightness directly, because brightness is measured by distance using the metre rule.
- The solar cell generates its own power; the lamp is just the light source. Do not connect the lamp into the solar cell circuit.