Physics 5054/41 — May/June 2025
Cambridge O-Level · Alternative to Practical · worked solutions for every part, with the mark scheme
Topics Observations and Measurements · Experimental Contexts · Analysis, Conclusions and Evaluation · Use of Techniques, Apparatus and Materials · Planning Experiments and Investigations
A student investigates the resistance of a lamp.
Fig. 1.1 shows the circuit used.
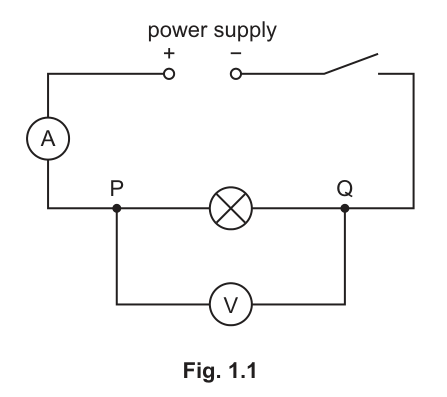
The student closes the switch.
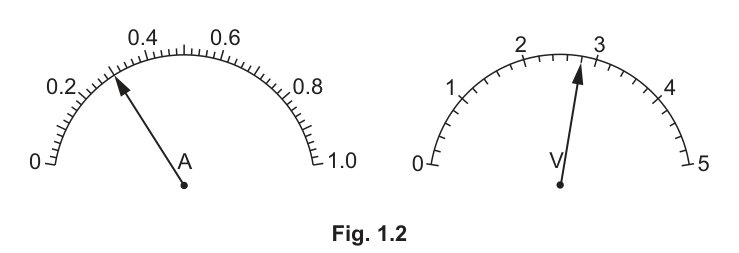
The readings of current and potential difference are shown in Fig. 1.2.
Record the readings shown.
= ______
= ______
Answer
IL = 0.30 A, VL = 2.8 V
Walkthrough
To read the ammeter in Fig. 1.2:
- The scale is labelled from to with major numbered divisions every .
- Between and , there are 10 small divisions, meaning each small division represents .
- The pointer is exactly halfway between and , on the 5th tick mark: .
To read the voltmeter in Fig. 1.2:
- The scale is numbered to with major numbered marks every .
- Between and , there are 10 small divisions, so each small division represents .
- The pointer is on the 8th small mark past (or 2 marks before ), which gives .
Key Takeaways
- Always determine the value of one small division on an analogue scale before taking a reading.
- Include appropriate precision based on the scale divisions.
Common Mistakes
- Reading the ammeter pointer incorrectly (e.g. miscounting divisions as or ).
- Forgetting the trailing zero on when the precision allows it (though is also credited).
Things to Be Careful About
- Ensure correct matching of the reading to the corresponding symbol ( for current in amperes, for voltage in volts).
The student opens the switch.
Suggest why the switch is opened after the readings are recorded.
Answer
To prevent the lamp/wires from heating up (or to prevent the power supply/cells from running down).
To prevent the circuit/lamp from heating up
Walkthrough
When current flows through a circuit, electrical energy is converted into thermal energy due to resistance. Opening the switch between measurements ensures that:
- The lamp and connecting wires do not heat up, which would otherwise change their resistance and introduce temperature-dependent errors.
- If batteries/cells are used, it prevents them from discharging unnecessarily.
Key Takeaways
- Keeping switches closed for prolonged periods in circuit experiments causes heating effects that alter resistance.
Common Mistakes
- Giving vague answers like "for safety" without specifying overheating or power drainage.
Things to Be Careful About
- Mentioning specific effects: heating of components/wires or running down the power source.
Use the equation
to calculate the resistance of the lamp. Give your answer to 2 significant figures.
= ______
Working
Rounding to 2 significant figures:
Answer
9.3 Ω
Walkthrough
- Use Ohm's law / resistance formula .
- Substitute the values from part (a)(i): and .
- Calculate the unrounded value:
- The question explicitly asks for 2 significant figures, so rounds to .
Key Takeaways
- Always read the significant figure requirement in calculation questions.
- gives the resistance in ohms () when is in volts and is in amperes.
Common Mistakes
- Leaving the answer as or , ignoring the "2 significant figures" instruction.
Things to Be Careful About
- Rounding properly: 3 is followed by 3, so round down to .
The student:
- rearranges the circuit and connects a 10 resistor in series with the lamp
- connects the voltmeter to measure the potential difference across the resistor and lamp combination.
In the space below, draw the new circuit with the resistor added.
Answer
Circuit diagram showing power supply, switch, ammeter, fixed resistor, and lamp all in series, with voltmeter connected in parallel across both the resistor and lamp combination.
Walkthrough
To draw the modified circuit:
- Maintain the series loop containing the power supply, open/closed switch, and ammeter.
- In the branch between and , place the fixed resistor (represented by a standard rectangle symbol) in series with the lamp (a circle with an 'X' inside).
- Connect the voltmeter in parallel across both the resistor and the lamp together, so that it measures the combined potential difference.
Key Takeaways
- A voltmeter is always connected in parallel across the specific component or combination of components being measured.
- Series components are connected one after another in a single loop.
Common Mistakes
- Drawing the voltmeter across only the lamp or only the resistor.
- Drawing the resistor in parallel with the lamp.
- Using incorrect component symbols (e.g. a zigzag line or missing circle for the lamp).
Things to Be Careful About
- Standard circuit symbols: rectangle for a fixed resistor, circle with cross for a filament lamp, circle with 'A' for ammeter, circle with 'V' for voltmeter.
The reading on the voltmeter does not change.
Fig. 1.3 shows the new current reading on the ammeter. This is current .
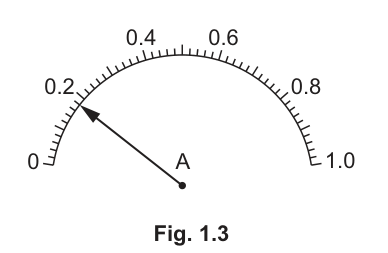
Record .
= ______
Use the equation in (a)(iii) to find the resistance of the lamp and the resistor connected in series.
= ______
Working
From the ammeter scale in Fig. 1.3:
Using the constant voltmeter reading :
Answer
IC = 0.18 A, RC = 15.6 Ω
Walkthrough
- Read from Fig. 1.3:
- Major divisions are every with 10 small tick subdivisions, so each small tick is .
- The pointer is 1 small division before , which is .
- Calculate :
- The question states the voltmeter reading does not change, so .
- Substitute and into :
- Quoting to 2 or 3 significant figures gives (or ).
Key Takeaways
- Reading before a major mark involves subtracting divisions ().
- Use the stated condition ( is unchanged) to obtain the potential difference needed for calculation.
Common Mistakes
- Misreading the scale as (counting 2 marks backwards instead of 1).
Things to Be Careful About
- Ensure you carry forward your value from part (a)(i).
Theory states that the value of in the new circuit is given by:
Calculate the resistance of the lamp.
= ______
Working
Answer
5.6 Ω
Walkthrough
- Use the provided formula:
- Substitute the value of calculated in (b)(ii), which is :
(If an unrounded value of was used, or is obtained).
Key Takeaways
- In a series circuit, the total resistance is the sum of the individual resistances (), hence .
Common Mistakes
- Forgetting to carry forward the calculated value of from part (b)(ii).
Things to Be Careful About
- Error carried forward (ecf) applies from part (b)(ii).
State how the brightness of the lamp changes in the new circuit compared to the circuit shown in Fig. 1.1, and explain why.
change in brightness of lamp ______
explanation ______
Answer
change in brightness of lamp: dimmer
explanation: The total resistance is higher so less current flows through the lamp (or lower lamp resistance because the filament does not get as hot).
change in brightness of lamp: dimmer; explanation: higher total resistance leads to lower current flowing through the lamp
Walkthrough
- Change in brightness: Adding the resistor in series increases the total resistance of the circuit. Since the potential difference across the combination remains the same, the current decreases from to . Less current and less power dissipated in the lamp means the lamp is dimmer.
- Explanation: Either of two physical explanations is accepted:
- Circuit view: The circuit resistance is greater, which reduces the current through the lamp, reducing its brightness.
- Filament temperature view: Because the current is smaller, less thermal energy is dissipated, the filament operates at a lower temperature, and its resistance decreases (from to ).
Key Takeaways
- Brightness of a filament lamp depends on the electrical power () delivered to it.
- Adding components in series increases total resistance and decreases current.
- Filament lamp resistance decreases when it is colder (operating at lower current).
Common Mistakes
- Stating the lamp gets brighter because the total resistance went up.
- Confusing the total circuit resistance with the individual lamp resistance.
Things to Be Careful About
- Ensure both the state (dimmer) and a valid causal reason (lower current / higher combination resistance / colder filament) are given.
A student investigates the light reflected from a plane mirror.
Fig. 2.1 shows a straight line AB.
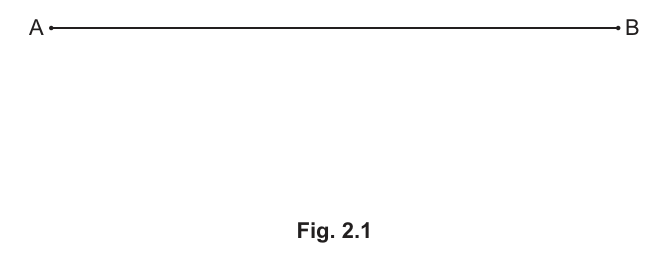
Draw a line from point A at an angle of in an anticlockwise direction from AB.
This line should be more than 10 cm long.
Label the end of the line as point C.
Answer
Draw a straight line from point A at an angle of anticlockwise to AB, extending to a length of at least 10 cm, and label the end C.
Line AC drawn at 30° to AB, length > 10 cm
Walkthrough
Using a protractor, place its center on point A with the baseline aligned along AB. Measure an angle of in the anticlockwise direction (above AB) and mark the point. Use a ruler to draw a straight line from A passing through this mark, extending it to a length of more than 10 cm (e.g. 11–12 cm). Label the end of this line C.
Key Takeaways
- Always align the center of the protractor accurately on the vertex (point A).
- Check the scale orientation: anticlockwise means rotating upwards from the horizontal line AB.
Common Mistakes
- Drawing the line shorter than 10 cm.
- Reading the wrong scale on the protractor (e.g. drawing instead of ).
Things to Be Careful About
- Ensure the line is drawn sharply and neatly using a sharp pencil and a ruler.
Mark a point D on the line AB, 4.0 cm from point A.
Draw a line perpendicular to AB through point D.
This line must also pass through the line AC that you have drawn in part (a)(i).
Label, with an E, the point where the line through point D passes through AC.
Answer
Mark point D on AB at a distance of 4.0 cm from A. Draw a perpendicular line through D that extends upwards to cross line AC, and label the intersection point E.
Point D marked 4.0 cm from A; perpendicular line DE drawn intersecting AC at E
Walkthrough
- Use a ruler to measure 4.0 cm from point A along the line AB towards B. Mark this point as D.
- Using a set square or protractor, construct a line through D perpendicular () to AB, extending upwards until it intersects the line AC.
- Label this intersection point as E.
Key Takeaways
- Perpendicular lines should be constructed at an exact angle of using a protractor or set square.
- Measuring distances should start precisely at the zero mark of the ruler.
Common Mistakes
- Inaccurate distance from A (not 4.0 cm).
- The line from D not being perpendicular to AB.
Things to Be Careful About
- Use a sharp pencil to ensure points D and E are precisely located.
The student:
- places a plane mirror along the line AC with the reflective surface facing point B
- arranges an illuminated slit so that a ray of light passes along the line DE.
The ray reflects from the mirror.
Answer
Draw a straight line through point E perpendicular () to the line AC.
Normal drawn perpendicular to AC at point E
Walkthrough
The normal is an imaginary line drawn perpendicular () to the reflecting surface at the point of incidence. Place the baseline of a protractor along the line AC with its origin at point E. Mark and draw a line (often dashed) through E.
Key Takeaways
- In optics, the normal is always perpendicular to the surface/boundary, not necessarily vertical or horizontal.
Common Mistakes
- Drawing the normal perpendicular to AB instead of perpendicular to the mirror line AC.
Things to Be Careful About
- Ensure the angle between AC and the normal is exactly .
Label the angle between DE and the normal you have drawn with a .
Measure and record angle .
= ______
Working
In triangle ADE, the angle at A is and the angle at D is . Therefore, angle AED = .
Since the normal at E is at to AC, the angle between DE and the normal is:
Answer
30°
Walkthrough
- Identify the angle between the incident ray line DE and the normal drawn at E. Label this angle .
- Measure directly using a protractor aligned with the normal and DE.
- By geometry, in right-angled triangle ADE (where and ), the angle . Since the normal is at to the line AC, angle .
- A measured value within the tolerance of (i.e. to ) is accepted.
Key Takeaways
- Angle of incidence is the angle between the incident ray and the normal, not between the ray and the mirror.
Common Mistakes
- Measuring the angle between DE and AC () instead of DE and the normal ().
Things to Be Careful About
- Ensure the protractor is properly centered at E.
The student:
- marks two points and on the reflected line
- removes the mirror and draws the reflected line through points and .
Describe how points and are chosen to give as accurate a reflected line as possible.
Answer
The points and should be placed far apart (at least 4 to 5 cm apart / not close together).
Points P1 and P2 should be placed at least 4 cm apart (as far apart as possible)
Walkthrough
When marking points or optical pins along a ray of light, placing them close together magnifies any small error in the position of either point, causing a large angular deviation when drawing the ray. To ensure maximum accuracy, the points and must be separated by a large distance (at least 4 cm, or as far apart as possible on the paper).
Key Takeaways
- In ray tracing experiments with pins or marked points, maximizing the distance between points minimizes angular alignment error.
Common Mistakes
- Suggesting vague precautions such as "be careful" or "use a good ruler" instead of specifying the separation of the points.
Things to Be Careful About
- The marking scheme specifically looks for the distance: "at least 4 cm", "further apart", or "not close together".
The student repeats the procedure with a ray of light striking the mirror at a different angle.
Fig. 2.2 shows a second line, labelled AʹBʹ.
On Fig. 2.2, draw a line from point Aʹ at an angle of in an anticlockwise direction from line AʹBʹ.
The line should be more than 10 cm long.
Label the end of the line with a Cʹ.
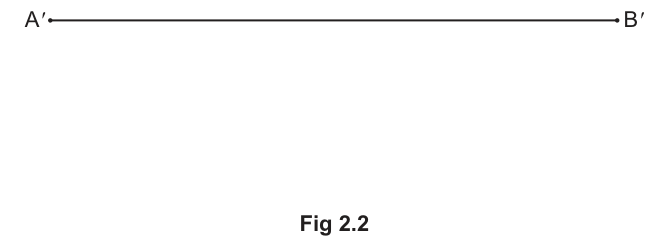
Answer
On Fig. 2.2, draw a straight line from point Aʹ at an angle of anticlockwise from line AʹBʹ, extending to a length greater than 10 cm, and label the end Cʹ.
Line AʹCʹ drawn at 60° to AʹBʹ, length > 10 cm
Walkthrough
- Place the center of a protractor at point Aʹ with the baseline aligned along AʹBʹ.
- Measure an angle of anticlockwise (upwards) from AʹBʹ.
- Using a ruler, draw a line from Aʹ through the mark, extending it to a length greater than 10 cm (e.g. 11–12 cm).
- Label the end of the line Cʹ.
Key Takeaways
- Follow instructions carefully regarding line length and labelling.
Common Mistakes
- Drawing the angle clockwise below AʹBʹ or drawing a line shorter than 10 cm.
Things to Be Careful About
- Ensure the angle is exactly ().
Mark a point Dʹ on the line AʹBʹ, 4.0 cm from point Aʹ.
Draw a line perpendicular to AʹBʹ through point Dʹ.
This line must also pass through the line AʹCʹ.
Label the point where the line through point Dʹ passes through AʹCʹ with an Eʹ.
Draw a normal to line AʹCʹ at point Eʹ.
Answer
- Mark point Dʹ on AʹBʹ at a distance of 4.0 cm from Aʹ.
- Draw a line perpendicular to AʹBʹ through Dʹ until it intersects AʹCʹ, and label the intersection point Eʹ.
- Draw a normal line through Eʹ perpendicular () to AʹCʹ.
Point Dʹ marked at 4.0 cm; perpendicular drawn to intersect AʹCʹ at Eʹ; normal drawn to AʹCʹ at Eʹ
Walkthrough
- Measure 4.0 cm from Aʹ along the line AʹBʹ and mark the point Dʹ.
- Using a set square or protractor, draw a perpendicular () line to AʹBʹ through Dʹ upwards until it crosses AʹCʹ.
- Label the intersection of this line with AʹCʹ as point Eʹ.
- Align a protractor along line AʹCʹ at point Eʹ and draw a normal line perpendicular () to AʹCʹ.
Key Takeaways
- Keep track of which line is perpendicular to which: DʹEʹ is perpendicular to AʹBʹ, whereas the normal is perpendicular to AʹCʹ.
Common Mistakes
- Confusing the two perpendiculars (drawing the normal perpendicular to AʹBʹ instead of AʹCʹ).
Things to Be Careful About
- Ensure clean and accurate pencil lines for clear intersection at Eʹ.
Label the angle between DʹEʹ and the normal you have drawn with an .
Explain one practical precaution that you take to ensure that the normal is accurately drawn.
Answer
Label the angle between DʹEʹ and the normal with .
Precaution:
Use a sharp pencil / use a set square (or protractor) carefully aligned with the line / view the scale perpendicularly to avoid parallax error when reading the protractor.
Use a sharp pencil (or avoid parallax error when using the protractor / use a set square)
Walkthrough
- Identify the angle between the ray DʹEʹ and the normal at Eʹ, and label it .
- To ensure that the normal is drawn accurately at to the mirror line:
- Use a sharp pencil to produce thin, precise lines.
- Use a set square or protractor properly aligned with line AʹCʹ.
- View the protractor scale directly from above (at ) to avoid parallax error.
Key Takeaways
- Accuracy in graphical constructions requires sharp pencils, appropriate drawing instruments (set squares, protractors), and avoiding parallax error.
Common Mistakes
- Stating vague answers like "work carefully" or "take your time".
Things to Be Careful About
- Make sure to give a specific, practical technique accepted by the syllabus.
Working
In triangle AʹDʹEʹ, angle at Aʹ is and angle at Dʹ is . Therefore, angle AʹEʹDʹ = .
Since the normal at Eʹ is at to AʹCʹ, the angle between DʹEʹ and the normal is:
Answer
60°
Walkthrough
- Measure the angle between the line DʹEʹ and the normal at Eʹ using a protractor.
- Geometrically, in the right-angled triangle AʹDʹEʹ, and , so .
- The normal is at to AʹCʹ, so the angle .
- Any measured value within ( to ) is accepted.
Key Takeaways
- The angle of incidence equals the tilt angle of the mirror relative to the baseline when the incident ray is perpendicular to the baseline.
Common Mistakes
- Measuring the angle between DʹEʹ and AʹCʹ () instead of DʹEʹ and the normal ().
Things to Be Careful About
- Ensure the protractor is correctly centered on Eʹ.
Theory suggests that:
State whether your results support this theory.
Give a reason for your answer.
Answer
Yes, the results support the theory because and , so the values are equal / very close and well within experimental error.
Yes, because α (60°) is equal to 2θ (2 × 30° = 60°), which is within experimental error
Walkthrough
- Compare the measured value of with :
- Since exactly (or very close within drawing tolerances), state "Yes".
- Give the reason: quote the values ( and ) and state that they are equal or within limits of experimental accuracy / experimental error.
Key Takeaways
- When asked if results support a theory, state clearly "Yes" (or "No") and provide a quantitative comparison or reference to experimental tolerance/error.
Common Mistakes
- Answering simply "Yes" without giving a reason or quoting values.
- Claiming they do not support the theory because of a difference of , which is well within experimental error.
Things to Be Careful About
- Always mention that values are "close / within experimental error" or explicitly show the calculation .
A student investigates the time taken for water to flow through a small hole in the bottom of a can.
The apparatus is arranged as shown in Fig. 3.1.
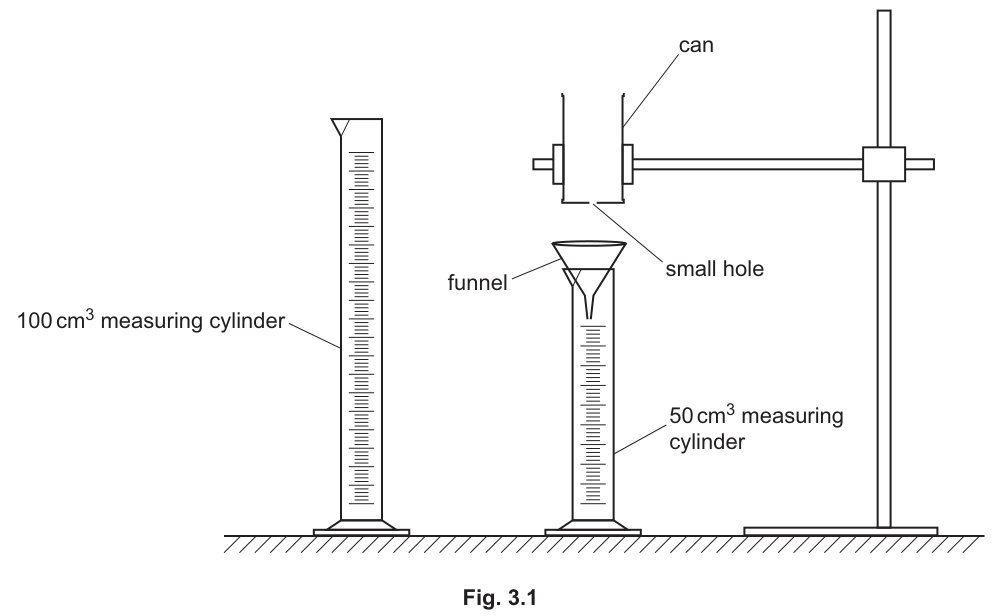
The student:
- uses the 100 measuring cylinder to measure a volume of water
- places a finger under the hole at the bottom of the can and pours the water into the can from the measuring cylinder
- removes the finger and, at the same time, starts the stopwatch
- records the time when the volume of water collected in the measuring cylinder is 30
- stops the stopwatch.
Fig. 3.2 shows the reading on the stopwatch at time .
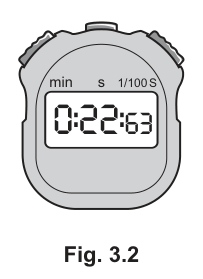
Record .
= ______
Answer
22.63
22.63
Walkthrough
The stopwatch display shows min : s 1/100s. The readout is 0:22:63, which means 0 minutes, 22 seconds, and 63 hundredths of a second. This is recorded as 22.63 s.
Key Takeaways
Digital stopcards read in the format min : s : 1/100s. Always include the trailing zero if the hundredths place is non-zero, but here 63 is already two digits.
Common Mistakes
Reading the display as 22.63 minutes or ignoring the hundredths column.
Things to Be Careful About
Ensure the unit is seconds (s) and the precision matches the instrument (0.01 s).
The student repeats (a)(i) and records the time shown in Fig. 3.3.
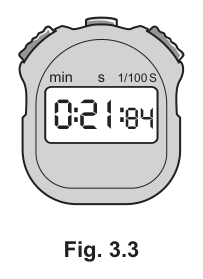
Record and find the average time of and .
Give your answer to the nearest 0.1 s.
= ______
= ______
Answer
= 21.84
= 22.2
21.84, 22.2
Walkthrough
The second stopwatch reading is 0:21:84, which is 21.84 s.
The average time is calculated as:
The question asks for the answer to the nearest 0.1 s, so we round 22.235 to 22.2 s.
Key Takeaways
Averages should be calculated using the full precision of the readings before rounding to the required decimal places.
Common Mistakes
Rounding the individual readings before averaging (e.g. 22.6 + 21.8 = 44.4 / 2 = 22.2, which gives the same result here but is bad practice), or rounding 22.235 up to 22.3.
Things to Be Careful About
The question specifically asks for the answer to the nearest 0.1 s. Always check the required precision.
The average rate of flow is given by:
Calculate and give the unit of your answer.
= ______ unit ______
Working
Rounding to 3 significant figures:
Answer
= 1.35
unit =
1.35, cm^3/s
Walkthrough
The formula for the average rate of flow is . Using the unrounded average time (to avoid rounding errors):
Rounding to 3 significant figures gives 1.35.
The unit is volume divided by time, which is .
Key Takeaways
When calculating derived quantities, use unrounded intermediate values to avoid cumulative rounding errors. The unit is derived from the formula: divided by s.
Common Mistakes
Using the rounded average (22.2) gives , which still rounds to 1.35, but it is better practice to use the exact value. Forgetting the unit or writing it as (5054 accepts both, but the slash form is standard in the paper).
Things to Be Careful About
The question asks for the unit as a separate blank. Ensure is written clearly.
The student repeats (a)(i) and (a)(ii) for values of , , , and . The volume of water collected in the measuring cylinder underneath the can is 30 for each value of .
The readings are shown in Table 3.1.
In Table 3.1:
- complete the headings, with units, in the top row of the table
- add your readings from (a)(i) and (a)(ii)
- calculate the average time for each set of readings.
Table 3.1
| / ______ | ______ | ______ | ______ |
|---|---|---|---|
| 100 | 16.0 | 16.2 | |
| 90 | 16.9 | 17.4 | |
| 80 | 18.9 | 19.7 | |
| 70 | |||
| 60 | 25.3 | 25.9 | |
| 50 | 31.1 | 31.3 |
Answer
| / | / s | / s | / s |
|---|---|---|---|
| 100 | 16.0 | 16.2 | 16.1 |
| 90 | 16.9 | 17.4 | 17.2 |
| 80 | 18.9 | 19.7 | 19.3 |
| 70 | 22.63 | 21.84 | 22.2 |
| 60 | 25.3 | 25.9 | 25.6 |
| 50 | 31.1 | 31.3 | 31.2 |
Working
Calculations for :
- :
- : (to nearest 0.1 s)
- :
- : From part (a), , ,
- :
- :
The trend is that increases as decreases.
Table completed with headings , , , ; row for filled with 22.63, 21.84, 22.2; other averages calculated.
Walkthrough
The table needs headings with units. The independent variable is volume in . The dependent variables are times , , and in s.
Row : The readings from part (a)(i) and (a)(ii) are 22.63 s and 21.84 s. The average is 22.2 s.
Other rows: Calculate the average of and to the nearest 0.1 s.
- 100: 16.1
- 90: 17.15 rounds to 17.2
- 80: 19.3
- 60: 25.6
- 50: 31.2
The trend shows that as the volume of water in the can decreases, the time taken for 30 to flow out increases.
Key Takeaways
Table headings must include the quantity and its unit (e.g., ). Averages should be consistent in precision with the raw data or as specified by the question.
Common Mistakes
Forgetting the units in the table headings. Writing values with too many decimal places (e.g. 17.15 instead of 17.2). Not transferring the readings from part (a) correctly to the row.
Things to Be Careful About
Ensure the column for is the last one. Rounding 17.15 to 17.2 is standard rounding (round half up).
On the grid provided in Fig. 3.4, plot a graph of on the -axis against on the -axis.
You do not need to start your axes at (0,0).
Draw the curve of best fit.
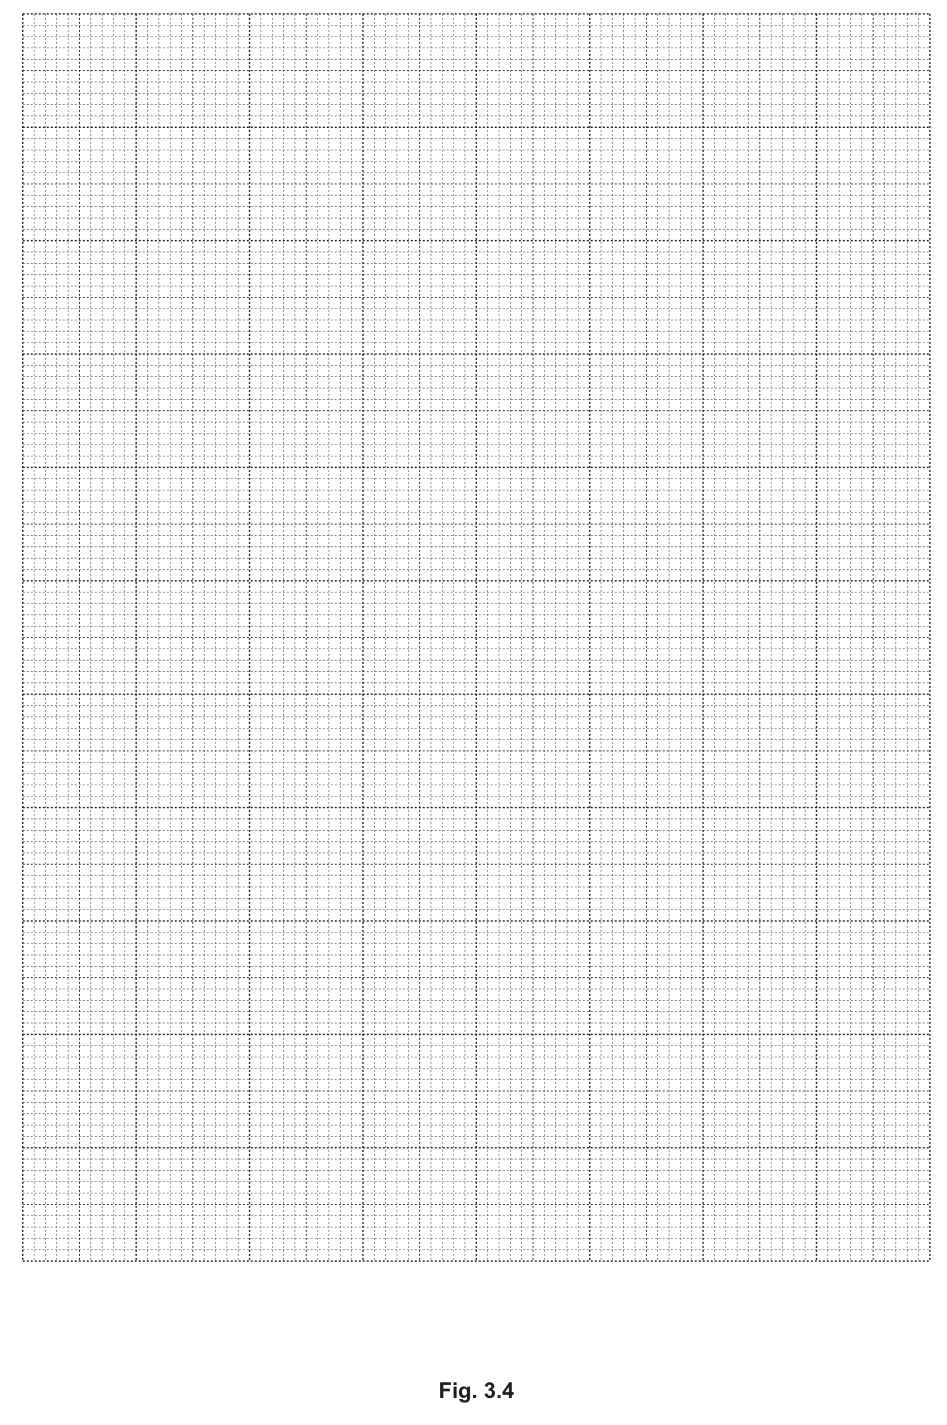
Answer
Working
Plot (y-axis) against (x-axis).
Points to plot:
- (100, 16.1)
- (90, 17.2)
- (80, 19.3)
- (70, 22.2)
- (60, 25.6)
- (50, 31.2)
The graph is not a straight line; it is a curve showing that as decreases, increases at an increasing rate. Draw a smooth curve of best fit through the points.
Graph of vs with axes labelled, scales used, points plotted to within half a square, and a smooth curved line of best fit.
Walkthrough
The x-axis represents / and the y-axis represents / s.
Scales: x-axis from 40 to 110 (or 50 to 100 with appropriate spacing). y-axis from 15 to 32.
Plot the six points calculated in part (b).
Since the flow rate depends on the pressure (height of water), and pressure decreases as water flows out, the time taken increases non-linearly. The curve should be concave up (slope increases as x decreases).
Key Takeaways
Graphs must have labelled axes with quantity and unit. Scales should be linear and use at least half the grid. Points must be plotted accurately (within half a small square). A curve of best fit should be thin and smooth, passing as close to as many points as possible with balanced errors.
Common Mistakes
Starting axes at (0,0) when not necessary (the scheme says 'You do not need to start your axes at (0,0)', and starting at 0 would make the curve very steep and hard to read). Plotting points inaccurately. Drawing a straight line through curved data. Forgetting to label axes with units.
Things to Be Careful About
The y-axis is and x-axis is . Do not swap them. The curve should not be forced through the origin.
Answer
For values of below 50 , the water pressure in the can is lower, so the rate of flow is slower. This means the time taken would be much longer, or the water may stop flowing before 30 is collected (not enough water/pressure).
The water pressure is lower, so the flow rate is slower and it may take too long or stop flowing before 30 cm^3 is collected.
Walkthrough
The flow of water through a hole depends on the pressure, which is determined by the height (and thus volume) of water in the can. As decreases, the pressure decreases, and the rate of flow decreases. If is too small (below 50 ), the pressure might not be sufficient to push 30 through the hole in a reasonable time, or the water might stop flowing entirely before the collecting cylinder has 30 .
Key Takeaways
In fluid experiments, the driving force (pressure head) changes as the volume changes. Low volumes can lead to impractically long times or cessation of flow.
Common Mistakes
Saying 'there is not enough water' without explaining that the pressure is too low to push the water out. Saying 'it takes too long' without linking it to the decreasing pressure/flow rate.
Things to Be Careful About
The answer must link the low volume to the physical consequence: lower pressure, slower flow, or stopping of flow.
On your graph, sketch the line you would expect to see if the small hole in the can is made slightly bigger. Label this line L.
Answer
Working
If the hole is bigger, the water flows out faster. For the same volume , the time will be shorter. Therefore, the new curve (line L) will be below the original plotted curve for the entire range of .
A curved line L drawn below the original curve of best fit, labelled L.
Walkthrough
A larger hole increases the rate of flow (more water can pass through per second). Therefore, for any given volume in the can, the time taken to collect 30 will be less. On the graph of vs , this means the new values of will be lower for the same . The new curve (line L) should be drawn below the original curve, following a similar shape.
Key Takeaways
Changing an apparatus parameter (hole size) that affects the rate of the process will shift the graph. Faster process -> lower time -> curve shifts down.
Common Mistakes
Drawing a straight line instead of a curve. Drawing the line above the original (which would imply slower flow). Forgetting to label the new line 'L'.
Things to Be Careful About
The line must be labelled 'L'. It should be a curve, not a straight line, to reflect the same non-linear relationship. It should be below the original line for all plotted values.
When a table tennis ball is dropped as shown in Fig. 4.1, it will bounce back upwards. Some of the initial gravitational potential energy (GPE) of the ball is lost in the bounce.
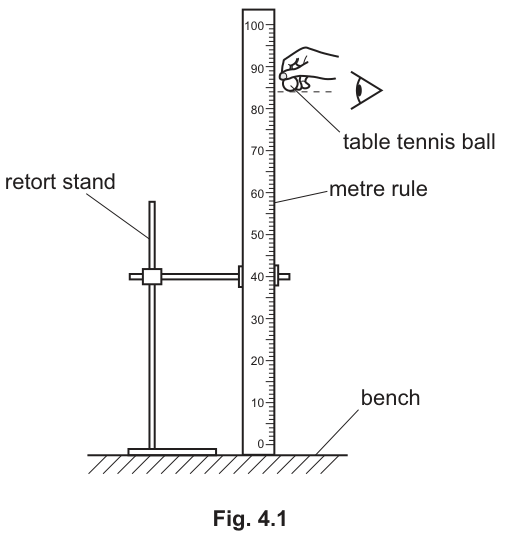
Plan an experiment to investigate how the height from which the ball is dropped affects the percentage of GPE lost in each bounce.
You may use any apparatus commonly found in a school laboratory in addition to the apparatus shown in Fig. 4.1.
GPE is given by the equation:
where is the mass of the ball, is the gravitational field strength and is the height above the bench from which the ball is dropped.
In your plan, you should:
- state what you will measure (dependent variable) and any additional apparatus you may use
- state any key variables to keep constant
- explain how you will ensure the results are as accurate as possible
- draw a table with column headings to display the results
- explain how you will use the results to draw a conclusion.
Answer
Method and additional apparatus:
- Use a top pan balance to measure the mass of the table tennis ball.
- Release the ball from a measured initial drop height using the metre rule.
- Measure the maximum height reached after the first bounce using the metre rule, ensuring the eye is level with the ball to avoid parallax error.
- Repeat the experiment for several different drop heights (e.g., 20, 40, 60, 80 cm).
Control variables:
- Use the same table tennis ball (keeping mass and material constant).
- Ensure the rebound surface (the bench) is the same for all drops.
Accuracy:
- Read the metre rule to the nearest 0.1 cm (or 1 mm) with the eye at eye level to avoid parallax.
- Repeat the rebound height measurement for each drop height and calculate an average to reduce random errors.
Results table:
| Drop height / cm | Rebound height / cm | Percentage of GPE lost / % |
|---|---|---|
Conclusion:
- Calculate the percentage of GPE lost for each drop height using . (Note: mass cancels out in this ratio, but measuring it satisfies the apparatus requirement).
- Compare the percentage of GPE lost across the different drop heights to determine if the drop height affects the percentage of energy lost. Alternatively, plot a graph of percentage GPE lost against drop height and draw a line of best fit.
See working
Walkthrough
- Method and apparatus (MP1 & MP2): The experiment requires measuring two heights: the initial drop height and the maximum rebound height . The metre rule in Fig. 4.1 is used for both. The mark scheme specifically credits a top pan balance to find the mass of the ball. Although mass cancels out when calculating the percentage of GPE lost (since ), including the balance in the apparatus list is required to earn the mark.
- Repeats (MP3): To investigate a relationship, the independent variable (drop height) must be varied. State that the ball is dropped from several different heights.
- Control variables (MP4): Any factor that could affect the bounce must be kept constant. The most important are the mass and material of the ball (use the same ball) and the nature of the rebound surface (use the same bench).
- Accuracy (MP5 context): To ensure accurate height readings, read the metre rule to the precision of the smallest division (0.1 cm or 1 mm) and keep the eye level with the ball to avoid parallax error. Repeating the rebound height measurement for each drop height and averaging reduces random errors.
- Results table (MP5): The table must have clear column headings that include both the quantity and its unit. A third column for the calculated percentage loss is useful for the conclusion.
- Conclusion (MP6): The dependent variable is the percentage of GPE lost. Explain that this percentage is calculated for each drop height and then compared across the table. Alternatively, plotting a graph of percentage GPE lost against drop height is an acceptable way to draw a conclusion.
Key Takeaways
- Planning questions require a structured response covering method, apparatus, variables, accuracy, data recording, and analysis.
- When calculating a percentage change or ratio involving the same quantity in the numerator and denominator (like mass in GPE), it cancels out, but you may still need to state that you measure it if the mark scheme asks for additional apparatus.
- Always include units in table headings and state how you will control variables to ensure a fair test.
Common Mistakes
- Forgetting to include a unit in the table headings (e.g., writing "Drop height" instead of "Drop height / cm").
- Stating "gravity" or "mass" as a control variable without specifying "use the same ball" or "same surface".
- Not explaining how the results will be used to draw a conclusion (e.g., just saying "compare the heights" instead of "calculate the percentage change and compare").
- Suggesting improvements like "be more careful" or "use better apparatus" which are rejected by 5054; instead, specify "read to the nearest 0.1 cm" or "repeat and average".
Things to Be Careful About
- Precision: The metre rule in Fig. 4.1 has millimetre markings, so readings should be to the nearest 0.1 cm (or 1 mm), including a trailing zero if necessary (e.g., 40.0 cm, not 40 cm).
- Parallax error: The diagram shows an eye looking at the ball. Emphasise that the eye must be at the same level as the ball when reading the height to avoid parallax.
- Percentage calculation: Remember that percentage change is . For GPE lost, this is .
- Graph axes: If choosing to plot a graph, the independent variable (drop height) goes on the x-axis and the dependent variable (percentage GPE lost) goes on the y-axis.