Physics 5054/32 — May/June 2025
Cambridge O-Level · Practical Test · worked solutions for every part, with the mark scheme
Topics Experimental Contexts · Observations and Measurements · Analysis, Conclusions and Evaluation · Use of Techniques, Apparatus and Materials · Planning Experiments and Investigations
In this experiment, you will investigate the refraction of a ray of light passing through a transparent block and determine the refractive index of the block.
You are provided with:
- a transparent, rectangular block
- a 30 cm ruler
- a protractor
- an illuminated slit or a raybox with a slit.
Fig. 1.2 is on page 3 of your question paper.
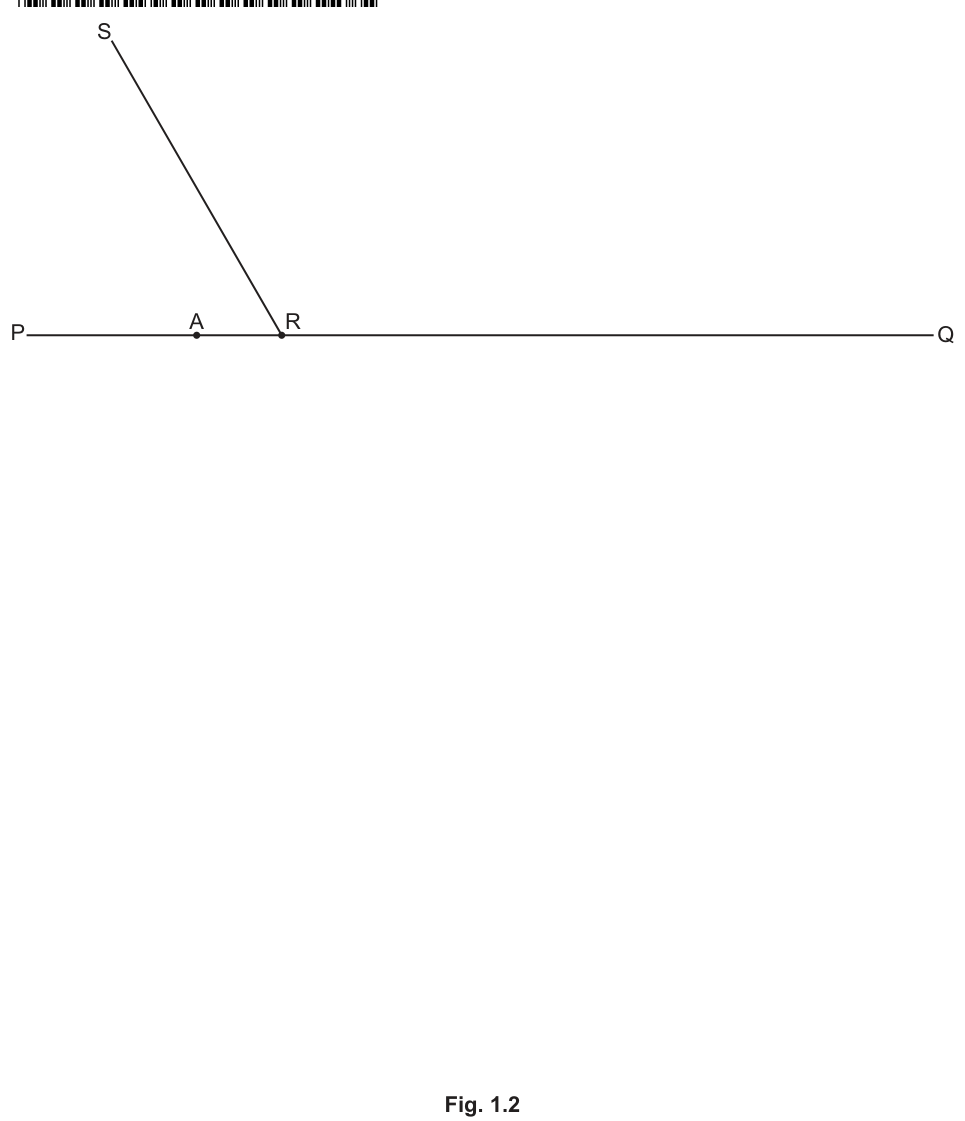
On Fig. 1.2, draw a normal to the line PQ at the point R. Extend your normal 6 cm above and at least 8 cm below PQ. Measure the angle between SR and the normal.
= ______
Answer
Normal drawn perpendicular to PQ at R, extending at least 6 cm above and 8 cm below PQ.
30
Walkthrough
The question asks for a normal to be drawn at point R on the line PQ. A normal is always drawn perpendicular (at 90°) to the boundary surface. Here, the boundary is the line PQ, so the normal is a vertical line through R. The mark scheme requires it to extend at least 6 cm above and 8 cm below PQ to allow for clear angle measurement. Once the normal is drawn, the angle between the incident ray SR and the normal is measured using a protractor. Reading from the diagram, this angle is 30°.
Key Takeaways
- A normal is always perpendicular to the surface at the point of incidence.
- Angles of incidence and refraction are always measured from the normal, not from the surface itself.
Common Mistakes
- Drawing the normal at an angle other than 90° to the surface.
- Measuring the angle between the ray and the surface PQ instead of the normal.
Things to Be Careful About
- Ensure the normal is drawn with sufficient length above and below the line as specified (6 cm above, 8 cm below) to allow accurate protractor placement.
- Read the protractor to the nearest degree.
Place the block on Fig. 1.2, with one of its long sides along the line PQ. The top left-hand corner of the block must be at A, as shown in Fig. 1.1.
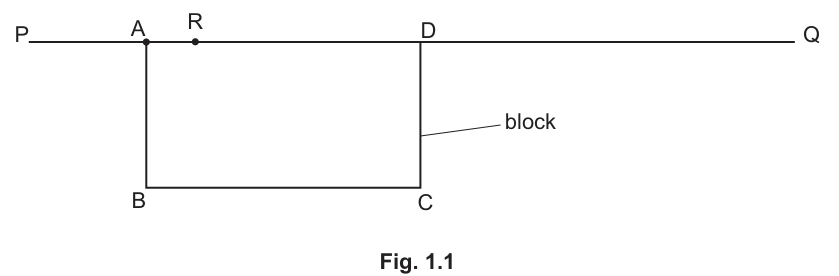
On Fig. 1.2, draw around the outline of the block.
Remove the block and label the outline of the block ABCD as shown in Fig. 1.1.
Mark the point where the normal crosses side BC of the block with the letter T.
Replace the block and switch on the lamp.
Position the illuminated slit so that a ray of light passes along the line SR towards R.
On Fig. 1.2, mark with small crosses (X) two points on the ray that leaves side BC of the block. Choose the position of the points so that the ray leaving the block can be accurately marked.
Switch off the lamp.
Answer
Two small crosses (X) marked on the ray leaving side BC of the block. The separation between the two crosses is greater than 3 cm.
Two crosses marked on the emerging ray, separated by > 3 cm
Walkthrough
After placing the block and aligning the light source so the ray travels along SR, the ray will refract at R, travel through the block, and emerge from side BC. To accurately determine the path of the emerging ray, two points must be marked on it using small crosses. The mark scheme requires the separation between these crosses to be greater than 3 cm. This ensures that when the line is drawn through them later, small errors in marking the points do not lead to large errors in the ray's direction.
Key Takeaways
- Marking two points on a ray path allows the ray's direction to be accurately drawn later.
- Greater separation between points reduces the relative error in the ray's direction.
Common Mistakes
- Marking points too close together (less than 3 cm apart), which amplifies alignment errors.
- Marking points on the wrong side of the block or not on the actual emerging ray.
Things to Be Careful About
- Use small, sharp crosses to minimize marking error.
- Ensure the points are clearly on the ray and not just near it.
Remove the block.
Draw a straight line through the two crosses to meet side BC of the block.
Label the point where the line meets BC with the letter E. Label the other end of the line as F.
Draw a straight line from E to R. This shows the path of the ray of light through the block.
Answer
2.3 cm
Walkthrough
The length is the distance from point E (where the emerging ray meets side BC) to point T (where the normal meets side BC). This is measured using a ruler. The mark scheme accepts values between 2.0 and 2.6 cm, recorded to the nearest 0.1 cm. An example value of 2.3 cm is used here.
Key Takeaways
- Lengths in optical experiments are measured to the precision of the instrument, typically 0.1 cm with a standard ruler.
Common Mistakes
- Recording measurements to the wrong precision (e.g., nearest 0.5 cm or nearest 1 cm).
- Reading the ruler from the wrong end.
Things to Be Careful About
- Ensure the ruler is aligned correctly along the line ET.
- Include the trailing zero if the measurement is to the nearest 0.1 cm (e.g., 2.0 cm, not 2 cm).
Answer
6.4 cm
Walkthrough
The length is the distance from point E to point R, representing the path of the light ray inside the block. This is measured using a ruler. The mark scheme accepts values between 6.2 and 6.6 cm, recorded to the nearest 0.1 cm. An example value of 6.4 cm is used here.
Key Takeaways
- The path length inside the block is a direct measurement from the entry point to the exit point.
Common Mistakes
- Measuring along the normal instead of the ray path.
- Incorrect precision.
Things to Be Careful About
- Align the ruler precisely along the line ER.
- Record to the nearest 0.1 cm as required.
Extend the line FE into the block until it meets the line RT.
Label the point where FE meets RT with the letter G.
Measure the length of EG.
= ______
Answer
4.6 cm
Walkthrough
The line FE (the emerging ray extended backwards) is extended until it meets the normal RT at point G. The length is then measured from E to G. This is a constructed length based on the ray paths. The mark scheme requires it to be recorded to the nearest 0.1 cm. Using the example values and , if , then , giving cm.
Key Takeaways
- Constructed lengths in ray diagrams are measured after drawing the geometric extensions.
Common Mistakes
- Measuring EG instead of EG (confusing points).
- Not extending the line accurately.
Things to Be Careful About
- Use a ruler to draw the line FE extended to meet RT accurately.
- Measure EG to the nearest 0.1 cm.
Use your values for and from (c)(i) and (c)(ii) to calculate a first value for the refractive index of the block.
Use the equation shown.
= ______
Working
Answer
1.39
Walkthrough
The first value of the refractive index, , is calculated using the given formula . Substituting the measured values cm and cm:
The mark scheme accepts values between 1.3 and 1.6, which is consistent with typical glass or plastic blocks.
Key Takeaways
- Refractive index is a dimensionless quantity; no units are required.
- The formula relates the path length inside the block to the perpendicular distance from the normal.
Common Mistakes
- Forgetting to multiply by 2 in the denominator.
- Including units in the final answer for .
Things to Be Careful About
- Use the unrounded values from measurements if possible, or at least 2-3 significant figures for intermediate steps.
- Give the final answer to 2 or 3 significant figures.
Use your values for and from (c)(ii) and (c)(iii) to calculate a second value for the refractive index of the block.
Use the equation shown:
= ______
Working
Answer
1.39
Walkthrough
The second value of the refractive index, , is calculated using the formula . Substituting the measured values cm and cm:
This value should be close to if the experiment was performed accurately.
Key Takeaways
- Two different geometric methods can be used to determine the refractive index from a single ray trace.
Common Mistakes
- Using the wrong values for and .
- Arithmetic errors in division.
Things to Be Careful About
- Ensure the values used are from the candidate's own measurements.
- Round the final answer to an appropriate number of significant figures (2 or 3).
Two quantities can be considered to be the same within the limits of experimental accuracy if their values are within 10% of each other.
Compare your value for the refractive index calculated in (d)(i) with the value calculated in (d)(ii).
State if your two values can be considered to be the same.
Support your statement with a calculation.
calculation
statement ______
Working
Answer
calculation: Percentage difference is 0% (or calculate using candidate's values, e.g., if and , difference is ).
statement: The two values can be considered to be the same because the percentage difference is less than 10%.
The values are within 10% of each other, so they can be considered the same.
Walkthrough
The question asks to compare and using the criterion that values are considered the same if they are within 10% of each other. This is typically done by calculating the percentage difference:
Using the example values and , the difference is 0%, which is clearly less than 10%. If a candidate had slightly different values, e.g., and , the difference would be , which is still less than 10%.
The statement must clearly say whether the values are the same or not, and the calculation must support this statement.
Key Takeaways
- Experimental results often have small variations due to measurement errors.
- A 10% tolerance is a reasonable criterion for comparing derived quantities in O Level physics.
Common Mistakes
- Stating the values are the same without providing the calculation.
- Calculating the percentage error incorrectly (e.g., using the wrong base value).
- Not reading the 10% criterion from the question.
Things to Be Careful About
- The calculation must explicitly use the values of and .
- The statement must directly answer the question: 'can be considered to be the same' or 'cannot be considered to be the same'.
One source of inaccuracy in this experiment is careless measurement.
Suggest another source of inaccuracy in this experiment.
Answer
- The thickness of the light rays makes it difficult to determine the exact central path.
- Difficulty in aligning the incident ray exactly with the line SR.
- Difficulty in placing the crosses accurately on the emerging ray.
Thickness of the light rays / difficulty in aligning the incident ray / difficulty placing crosses accurately
Walkthrough
The question asks for a source of inaccuracy other than careless measurement. In ray-tracing experiments, several inherent limitations exist:
- Thickness of the light ray: The raybox produces a beam of finite thickness, not a single line. This makes it difficult to determine the exact central path of the ray, especially when marking points or drawing lines.
- Alignment of the incident ray: It is difficult to ensure the raybox is positioned exactly so that the ray travels precisely along the printed line SR.
- Marking accuracy: Placing small crosses on the paper to mark the ray's path introduces small errors, especially if the ray is faint or the paper moves.
Any one of these valid points earns the mark.
Key Takeaways
- Practical experiments have inherent limitations beyond human carelessness.
- Understanding these limitations helps in suggesting improvements.
Common Mistakes
- Saying 'human error' or 'be more careful', which are not specific sources of inaccuracy.
- Suggesting improvements without first identifying the source of error.
Things to Be Careful About
- The source of inaccuracy must be specific to this experiment (ray tracing through a block).
- Do not repeat 'careless measurement' as given in the question.
In this experiment you will investigate the resistance of a thermistor at different temperatures.
You are provided with:
- a power source
- a switch
- a voltmeter with two leads that may be connected between different points in the circuit shown in Fig. 2.1
- a thermistor placed inside an empty beaker
- a 220 resistor
- a stirring thermometer
- a supply of hot water from the supervisor
- paper towels to mop up spillages.
The supervisor has set up the circuit shown in Fig. 2.1.
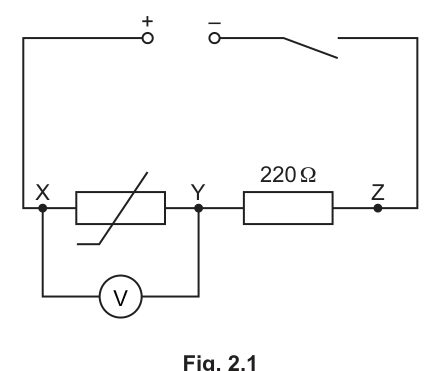
Measure the room temperature and record it on the answer line.
= ______
Close the switch.
Record the potential difference across the thermistor while the thermistor is at room temperature in Table 2.1 on page 6.
Open the switch.
Answer
= 20.0 (example realistic value)
= 3.5 V (example value , recorded to 1 decimal place)
Room temperature = 20.0 ; = 3.5 V (example values within scheme limits)
Walkthrough
The candidate must read the room temperature from the stirring thermometer and record it to at least one decimal place. A realistic room temperature is typically between 18 and 25 . After closing the switch, the candidate reads the potential difference across the thermistor . The mark scheme requires this value to be less than 4.2 V, which is consistent with a typical 4.5 V or 6 V d.c. supply where the 220 resistor shares some of the voltage. Both readings must be recorded to at least 1 decimal place for consistency.
Key Takeaways
Candidates must record experimental readings to the precision of the instrument and to a consistent number of decimal places down a column.
Common Mistakes
- Recording the temperature without a decimal place when the scale allows one.
- Recording a value greater than 4.2 V, which would indicate a faulty circuit or incorrect supply voltage.
Things to Be Careful About
Always quote the unit ( and V). Ensure the number of decimal places matches the precision of the instrument (usually 0.1 for a laboratory thermometer and 0.1 V or 0.01 V for a digital voltmeter).
Disconnect the voltmeter from points X and Y.
Reconnect the voltmeter across the 220 resistor between points Y and Z.
Close the switch.
Record the potential difference across the 220 resistor while the thermistor is at room temperature in Table 2.1 on page 6.
Open the switch.
Answer
= 0.8 V (example value , recorded to 1 decimal place)
= 0.8 V (example value , to 1 d.p.)
Walkthrough
The voltmeter is moved from across the thermistor (X-Y) to across the fixed 220 resistor (Y-Z). The candidate records while the thermistor is still at room temperature. The mark scheme requires . This is physically sensible because the thermistor at room temperature typically has a resistance much larger than 220 (often several k), meaning most of the supply voltage drops across the thermistor ( is large) and only a small fraction drops across the 220 resistor ( is small).
Key Takeaways
Reconnecting a voltmeter to measure different components in a series circuit and ensuring readings are recorded consistently.
Common Mistakes
- Forgetting to open the switch before moving the voltmeter leads.
- Recording with a different number of decimal places than .
Things to Be Careful About
The value of must be less than or equal to half of . If it is not, the student should check their circuit connections or note that their thermistor may have an unusually low room-temperature resistance.
Table 2.1
| thermistor at room temperature | |||
| thermistor at temperature of hot water |
Disconnect the voltmeter from points Y and Z.
Reconnect the voltmeter across points X and Y.
Ask your supervisor to pour hot water into the beaker until it is about half full.
Carefully place the thermometer in the hot water and stir the water gently.
Wait for about 30 s.
Measure the temperature of the hot water and record it on the answer line.
= ______
Answer
= 75.0 (example value , recorded to 1 decimal place)
= 75.0 (example value , to 1 d.p.)
Walkthrough
Hot water is added to the beaker, and the thermometer is placed in it. After waiting for 30 seconds and stirring, the candidate reads the maximum temperature reached. The mark scheme requires this value to be greater than 60 to ensure a significant temperature change for the thermistor. The reading must be recorded to at least 1 decimal place.
Key Takeaways
Measuring the maximum temperature of a heated liquid to ensure thermal equilibrium has been reached.
Common Mistakes
- Recording a temperature below 60 , which would not provide a large enough change in thermistor resistance.
- Reading the thermometer before it has had time to expand and reach the true maximum temperature.
Things to Be Careful About
Always record the highest temperature reached, not just an average. The thermometer must be read to the same precision (1 decimal place) as the room temperature reading.
Close the switch.
Record the new potential difference while the thermistor is at the temperature of the hot water in the bottom row of Table 2.1.
Open the switch.
Answer
= 2.0 V (example value less than the room temperature reading, recorded to 1 decimal place)
= 2.0 V (example value less than the room temperature reading, to 1 d.p.)
Walkthrough
With the voltmeter still across the thermistor (X-Y), the candidate records the new potential difference while the thermistor is heated. As the thermistor is a Negative Temperature Coefficient (NTC) device, its resistance decreases as temperature rises. In a series circuit with a fixed resistor, a decrease in the thermistor's resistance means it takes a smaller share of the supply voltage. Therefore, must be less than the value recorded at room temperature.
Key Takeaways
Understanding how an NTC thermistor's resistance changes with temperature and how this affects voltage distribution in a series circuit.
Common Mistakes
- Recording a value that is greater than or equal to the room temperature value. This would indicate a PTC thermistor or a circuit error.
- Not maintaining the same number of decimal places as previous readings.
Things to Be Careful About
The value of MUST be strictly less than the value recorded in part (b)(i). This is a key check for the candidate to ensure their NTC thermistor is behaving correctly.
Disconnect the voltmeter from points X and Y.
Reconnect the voltmeter across the 220 resistor between points Y and Z.
Close the switch.
Record the new potential difference while the thermistor is at the temperature of the hot water in the bottom row of Table 2.1.
Open the switch.
Hold the thermistor by its connecting leads and carefully remove it from the hot water. Place it on the bench away from the rest of the circuit.
Answer
= 1.2 V (example value, recorded to the same number of decimal places as above)
= 1.2 V (example value, to same number of decimal places as above)
Walkthrough
The voltmeter is moved to across the 220 resistor (Y-Z) to record at the hot temperature. As the thermistor's resistance decreased, the total circuit resistance decreased, so the current increased. Therefore, the voltage across the fixed 220 resistor () must have increased compared to its room-temperature value. The candidate must record this value to the same number of decimal places as all other voltage readings in the table.
Key Takeaways
Recording experimental data consistently to ensure valid comparisons and calculations.
Common Mistakes
- Using a different number of decimal places for this reading (e.g., recording 1.2 instead of 1.20 if others are to 2 d.p.).
Things to Be Careful About
Consistency in decimal places is a marking point. The value itself should be greater than the room-temperature recorded in part (a)(ii).
Answer
To allow the thermometric liquid time to expand and reach thermal equilibrium, so that the highest (maximum) temperature of the hot water is recorded.
To allow the thermometer to reach thermal equilibrium and record the maximum temperature.
Walkthrough
When hot water is poured into the beaker, the thermometer bulb is initially cooler than the water. It takes time for heat to transfer from the water to the thermometer and for the thermometric liquid inside to expand to its final volume. Waiting for 30 seconds ensures that the temperature reading has stabilised and represents the true maximum temperature of the water, not a value that is still rising.
Key Takeaways
Thermal equilibrium requires time for heat transfer; instruments need time to respond to temperature changes.
Common Mistakes
- Saying "to make the water hotter" or "to heat the thermometer" (the thermometer is not the object being heated for the experiment's purpose; the water's temperature is what matters).
Things to Be Careful About
Accept any valid point about reaching the maximum temperature, allowing the liquid to expand, or reaching thermal equilibrium. Do not accept "to let it cool down".
Answer
To ensure that the water is at a uniform temperature throughout the beaker.
To ensure the water is at a uniform temperature.
Walkthrough
Hot water is less dense than cold water, so without stirring, a temperature gradient will form in the beaker (hotter water at the top, cooler at the bottom). Stirring promotes convection, mixing the water so that the temperature is the same everywhere. This ensures the thermometer reads the true average temperature of the water, which is also the temperature of the thermistor immersed in it.
Key Takeaways
Stirring ensures thermal equilibrium and a uniform temperature distribution in a liquid.
Common Mistakes
- Saying "to cool the water down" or "to mix the hot and cold water" (unless there is cold water added, which there isn't here).
Things to Be Careful About
The key phrase is "uniform temperature". The student must explain that stirring removes temperature gradients.
The current in the circuit is calculated using the equation
where .
Use your measurements recorded in Table 2.1 to calculate the current at room temperature and at the temperature of the hot water .
Record your answers in Table 2.1.
Working
Using the equation with :
At room temperature :
Substituting the example value :
At hot temperature :
Substituting the example value :
Answer
at = 0.0036 A (or A)
at = 0.0055 A (or A)
Current at room temperature = 0.0036 A; Current at hot temperature = 0.0055 A (example values)
Walkthrough
The current in the series circuit is the same everywhere. The 220 resistor is a fixed, known resistance, so the current can be calculated using Ohm's law: . The candidate must substitute the two values from Table 2.1 (one at room temperature, one at hot temperature) into this equation. The results should be recorded in the table to 2 or 3 significant figures.
Key Takeaways
Using a known fixed resistor and the voltage across it to determine the current in a series circuit.
Common Mistakes
- Using instead of in the calculation (this would give the current if 220 was across , which is incorrect).
- Forgetting to convert the final answer to standard form or using too few significant figures.
Things to Be Careful About
The resistance is exactly 220 . Ensure the candidate uses the correct value for each row. The current at the hot temperature MUST be greater than the current at room temperature because the total resistance of the circuit has decreased.
The resistance of the thermistor is calculated using the equation:
Use your data in Table 2.1 to calculate at room temperature and at the temperature of the hot water .
at room temperature = ______
at temperature of the hot water = ______
Working
Using the equation :
At room temperature :
At hot temperature :
Answer
at room temperature = 972
at temperature of the hot water = 364
(Note: The resistance of the thermistor when hot is less than the resistance when cold.)
at = 972 ; at = 364 (example values; hot resistance < cold resistance)
Walkthrough
The resistance of the thermistor at each temperature is found using Ohm's law rearranged: . The candidate substitutes the and calculated values for each row. The result demonstrates that the thermistor is an NTC (Negative Temperature Coefficient) device, as its resistance has decreased significantly as the temperature increased from room temperature to the hot water temperature.
Key Takeaways
Calculating the resistance of an unknown component using a voltmeter and an ammeter (or in this case, a known resistor and voltmeter).
Common Mistakes
- Using the wrong value (e.g., using the hot with the cold ).
- Not realising that the final answer must show at hot temperature < at room temperature.
Things to Be Careful About
The mark scheme specifically requires that the resistance of the thermistor when hot is less than when cold. If the calculated values do not show this, the student has likely made an error in their readings or calculations. Round to 2 or 3 significant figures.
Calculate , the average change in the resistance per degree Celsius for the thermistor as its temperature rises from room temperature to the temperature of the hot water .
Use the equation shown.
= ______
Working
Using the equation:
Substituting the example values:
Answer
= 11.1
= 11.1 (example value)
Walkthrough
The average change in resistance per degree Celsius, , is calculated by dividing the total change in resistance () by the total change in temperature (). The candidate must substitute the values calculated in part (f) and the temperatures recorded in parts (a)(i) and (b)(i). Note that the change in resistance is taken as a positive value (cold resistance minus hot resistance) since the resistance decreases with temperature.
Key Takeaways
Calculating a rate of change (gradient-like quantity) from experimental data.
Common Mistakes
- Calculating the change in temperature as , which would give a negative denominator and a negative .
- Forgetting to use the derived resistance values from part (f) and instead trying to use voltages directly.
Things to Be Careful About
Ensure the units are correct: . The value of should be positive. Round to 2 or 3 significant figures consistent with the data.
In this experiment you will investigate the stretching of a spring.
You are provided with:
- two bosses, clamps and stands
- a steel spring
- a set square
- a metre rule with a millimetre scale
- a set of 1.0 N loads.
The spring and the metre rule have been set up for you as shown in Fig. 3.1.
Do not remove the spring from the clamp or adjust the height of the clamp.
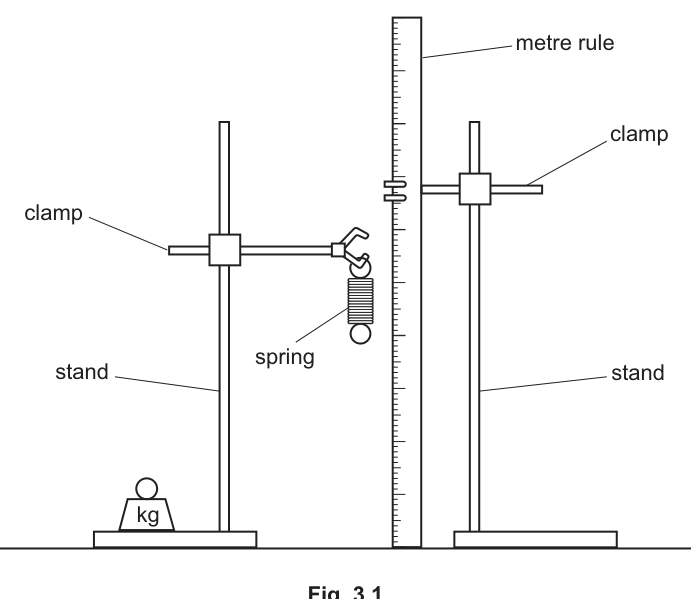
Take the reading on the metre rule level with the top of the spring.
Take the reading on the metre rule level with the bottom of the spring.
Do not include the loops at the top and the bottom of the spring in your measurements. Use the set square to help you take the readings.
Record your readings to the nearest 0.1 cm.
reading = ______
reading = ______
Working
Read the position on the vertical metre rule level with the top and bottom of the coiled part of the spring to the nearest .
(Representative experimental values:
reading
reading )
Answer
reading
reading
reading Rt = 45.0 cm, reading Rb = 47.5 cm (candidate values to 0.1 cm)
Walkthrough
The candidate reads the metre rule positioned next to the clamped spring:
- Find the reading aligned with the top of the coils of the spring.
- Find the reading aligned with the bottom of the coils of the spring.
- Both measurements must exclude the loops at the ends and must be recorded to the nearest (or ), ensuring trailing zeros are written if the reading falls exactly on a major division.
Key Takeaways
- Always record readings from a metre rule graduated in millimetres to the nearest .
- Exclude non-active parts of the apparatus (such as attachment loops) when measuring the active length of a spring.
Common Mistakes
- Including the loops at the top or bottom of the spring.
- Omitting the decimal place (e.g., writing instead of ).
Things to Be Careful About
- Ensure the readings are recorded to decimal place in centimetres.
Draw on Fig. 3.1 to show how you use the set square to take a reading from the metre rule level with the bottom of the spring.
Answer
Draw a set square with one edge lying flat against the vertical metre rule and a perpendicular horizontal edge extending directly across to the bottom of the coiled part of the spring.
Set square drawn with one straight edge against the vertical metre rule and the horizontal perpendicular edge aligned with the bottom of the spring coils
Walkthrough
To transfer a horizontal level accurately from the bottom of the coiled spring to the adjacent vertical metre rule without parallax error:
- One perpendicular edge of the set square is held flush against the vertical face of the metre rule.
- The other perpendicular edge extends horizontally to touch or align with the bottom of the coiled section of the spring.
- This ensures the line of sight/reference is exactly at to the ruler.
Key Takeaways
- A set square ensures that horizontal levels are projected at exactly right angles to a vertical scale, eliminating parallax errors.
Common Mistakes
- Drawing the set square tilted or not flush against the metre rule.
- Aligning the set square with the bottom of the hanging loop rather than the bottom of the coils.
Things to Be Careful About
- Make sure the right-angle corner of the set square is clearly shown sitting on the metre rule.
Calculate the length of the spring with no load suspended from it. Use the equation shown:
Show your working.
Record and in Table 3.1 for load .
Working
Answer
Record and in Table 3.1 for load .
l = Rb - Rt calculated correctly and recorded in Table 3.1
Walkthrough
- Use the values obtained in part (a)(i).
- Calculate the initial length of the spring using .
- Show the working clearly.
- Enter the value of and the calculated into the column for in Table 3.1.
Key Takeaways
- The unstretched length of the spring is the difference between the lower and upper scale readings.
Common Mistakes
- Forgetting to write the values into Table 3.1.
- Arithmetical errors in the subtraction.
Things to Be Careful About
- Keep the number of decimal places consistent with the readings ().
Place a load on the spring.
Take readings to determine the new length of the spring.
Record the new reading and the new length of the spring for load in Table 3.1.
Working
With load :
Answer
Record (e.g. ) and (e.g. ) for in Table 3.1.
Rb and l values for 1.0 N load recorded in Table 3.1
Walkthrough
- Suspend a load from the bottom loop of the spring.
- Read the new position of the bottom of the coils, , using the set square to avoid parallax.
- Calculate the new length: (where remains constant at the top).
- Record both and in the column of Table 3.1.
Key Takeaways
- Adding a tensile load extends the spring, increasing and thus increasing .
Common Mistakes
- Forgetting to subtract to find the length .
Things to Be Careful About
- Ensure the spring has stopped oscillating before taking the reading.
Repeat the procedure in (b)(i) for loads , , and , and record your values of and in Table 3.1. You may use the space provided for working.
Table 3.1
| load | 0.0 | 1.0 | 2.0 | 3.0 | 4.0 | 5.0 |
|---|---|---|---|---|---|---|
| reading | ||||||
| length |
Working
Take readings of for each load from to , compute , and enter all values into Table 3.1.
Answer
Table 3.1 (representative completed values):
| load | 0.0 | 1.0 | 2.0 | 3.0 | 4.0 | 5.0 |
|---|---|---|---|---|---|---|
| reading | 47.5 | 49.5 | 51.6 | 53.4 | 55.5 | 57.6 |
| length | 2.5 | 4.5 | 6.6 | 8.4 | 10.5 | 12.6 |
Complete Table 3.1 with all values of Rb and l increasing with load L
Walkthrough
- Sequentially add loads in increments of up to .
- For each load, measure the lower reading on the metre rule.
- Calculate the corresponding total length .
- Enter all values into Table 3.1.
- Check that as load increases, both and increase monotonically.
Key Takeaways
- In a spring extension experiment, length increases systematically with load.
- A full data table must show consistent precision (all readings to 1 decimal place).
Common Mistakes
- Inconsistent decimal places down a table column.
- Inverting the load values or miscalculating .
Things to Be Careful About
- Ensure the metre rule does not shift between load changes.
On the grid provided in Fig. 3.2 on page 11, plot a graph of on the y-axis against on the x-axis.
Start from the origin (0, 0).
Draw the straight line of best fit.
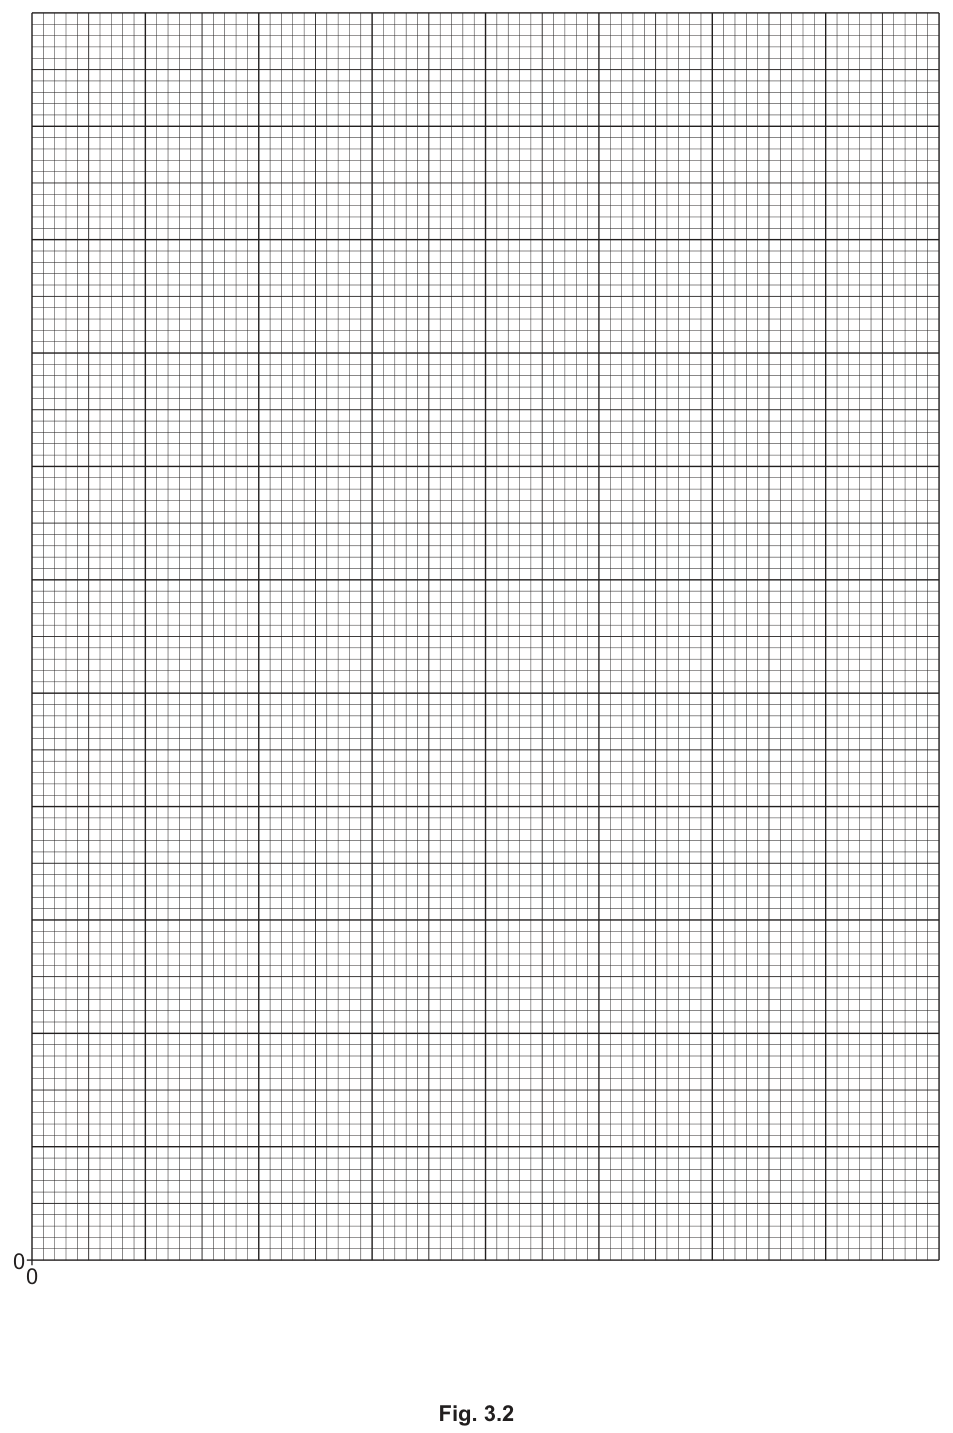
Working
- Axes: Horizontal axis labelled (or ) and vertical axis labelled (or ).
- Origin: Must start from .
- Scales: Linear and occupy more than half the grid in both directions (e.g. x-axis: ; y-axis: or similar convenient scale).
- Plotting: All 6 points from Table 3.1 plotted to within small square.
- Line: A single, thin, straight line of best fit drawn through the points, with an intercept on the y-axis at (the unstretched length).
Answer
Graph of l against L plotted with labelled axes, linear scales from (0, 0), accurate points, and a straight line of best fit
Walkthrough
- Scale selection: The question specifies starting from . Choose sensible, easy-to-read linear scales such that the plotted points occupy at least half of the grid along both the horizontal and vertical axes.
- Axis labelling: Label the x-axis with quantity and unit: . Label the y-axis with quantity and unit: .
- Plotting points: Plot each point from Table 3.1 as a small neat cross or a dot in a circle , accurately positioned within half a small grid square.
- Line of best fit: Use a long transparent ruler to draw a single, thin, continuous straight line of best fit that evenly balances the plotted points on either side. Note: The line will NOT pass through the origin because the spring has an initial unstretched length when .
Key Takeaways
- Scales must be linear (never non-linear or awkward like multiples of 3 or 7) and use of the grid.
- Points must be plotted accurately to within half a small square.
- A straight line of best fit must be thin and balance scatter evenly.
Common Mistakes
- Forcing the straight line to pass through the origin instead of intersecting the y-axis at .
- Drawing a thick, fuzzy, or "tramline" best-fit line.
Things to Be Careful About
- Ensure units are included on both axis labels.
Use your data in Table 3.1 and the graph in Fig. 3.2 to determine the extension of the spring when a load of 3.5 N is added to the spring.
Show your working.
extension = ______
Working
- From the graph in Fig. 3.2, read the stretched length at :
- The initial unstretched length at is:
- Calculate the extension :
Answer
extension =
7.0 cm (or candidate value: l at 3.5 N minus l_0)
Walkthrough
- Locate on the horizontal axis of the graph.
- Follow vertically up to meet the line of best fit, then move horizontally across to read the corresponding length on the vertical axis.
- Extension is defined as the increase in length beyond the original unstretched length:
- Subtract the unstretched length (the y-intercept or the length at ) from the value read from the graph.
Key Takeaways
- .
- Stretched length must be read directly from the line of best fit, not calculated assuming proportionality.
Common Mistakes
- Quoting the total length as the extension without subtracting .
- Reading from a data point rather than the line of best fit.
Things to Be Careful About
- Ensure the value of subtracted matches the candidate's initial length from Table 3.1 / y-intercept.
A student suggests that the stretched length of the spring is directly proportional to load .
State if your data supports this suggestion.
Justify your statement using your data in Table 3.1 on page 10 or the graph in Fig. 3.2 on page 11.
statement ______
justification ______
Answer
statement: No
justification: The graph of against does not pass through the origin (there is a non-zero y-intercept when ) / doubling the load does not double the length / the ratio is not constant.
statement: No; justification: The graph does not pass through the origin (or ratio l/L is not constant)
Walkthrough
For two quantities to be directly proportional ():
- A graph of against must be a straight line that passes through the origin .
- The ratio must be constant.
- Doubling the independent variable () must double the dependent variable ().
Looking at the graph and data:
- When , , so the line has a positive y-intercept and does not pass through .
- For example, when , ; when , , which is not .
- Therefore, total length is NOT directly proportional to load (it is the extension , not the length , that is directly proportional to load).
Key Takeaways
- Direct proportionality requires a straight line through .
- Total spring length does not pass through the origin because of the non-zero initial length .
Common Mistakes
- Confusing length with extension (extension is directly proportional to load, but length is not).
- Answering "Yes" simply because the graph is a straight line.
Things to Be Careful About
- Ensure the justification explicitly mentions that the line does not pass through the origin or demonstrates that the ratio is not constant.
Line of sight (parallax) errors can occur when readings are taken from a metre rule.
State one practical technique, other than using a set square, that ensures accurate readings are taken from a metre rule.
Answer
View the metre rule scale perpendicularly / at right angles / at (at eye level) when taking the reading.
(or place the metre rule as close as possible to the spring)
View the scale perpendicularly / at eye level (or place the rule close to the spring)
Walkthrough
Parallax error occurs when the observer's line of sight is not perpendicular to the scale of the measuring instrument, causing a displacement between the object and the scale marking.
Practical techniques to prevent or minimize parallax error include:
- Viewing perpendicular to the scale: Looking directly at eye level at to the ruler mark.
- Minimizing distance: Positioning the ruler as close as possible to (or touching) the spring so there is minimal gap between the reference point and the scale.
Since the question asks for a technique other than using a set square, either of these valid methods scores the mark.
Key Takeaways
- Always view scales at eye level (perpendicularly / ) or minimize the separation between the object and the scale to prevent parallax error.
Common Mistakes
- Giving vague answers like "look carefully" or "use a digital ruler".
- Mentioning a set square when the question explicitly states "other than using a set square".
Things to Be Careful About
- Use clear scientific terminology: "perpendicular", "at right angles", "at eye level".
As a metal ball falls through a liquid, it experiences a frictional force from the liquid that opposes the motion of the metal ball.
Plan an experiment to determine the relationship between the density of a liquid contained in a measuring cylinder and the average speed of a metal ball falling through the liquid from the surface of the liquid to the bottom of the cylinder.
The average speed of the ball is calculated using the equation:
The arrangement of the apparatus is shown in Fig. 4.1.
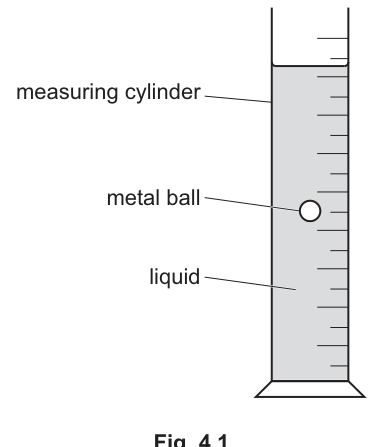
The apparatus available includes:
- a measuring cylinder
- a metal ball
- a selection of different liquids whose densities are known.
You are not required to do this experiment.
In your plan include:
- any other apparatus needed
- a brief description of the method, including what you will measure and how you make sure that your measurements are accurate
- the variables you will control
- a results table to record your measurements (you are not required to enter any readings in the table)
- how you will process your results to draw a conclusion.
Additional Apparatus
- Ruler (or measuring tape) to measure the distance the ball falls.
- Stopwatch (or timer) to measure the time taken.
Method
- Measure the height of the liquid in the measuring cylinder using the ruler.
- Drop the metal ball from rest at the surface of the liquid.
- Use the stopwatch to measure the time taken for the ball to reach the bottom of the cylinder.
- Calculate the average speed using .
- Repeat the experiment for each of the different liquids.
Control Variables
- Keep the same height (or volume) of liquid in the measuring cylinder for each trial.
- Use the same metal ball (same mass, volume, and shape) for all trials.
Results Table
| Density of liquid / | Time taken / s | Average speed / |
|---|---|---|
Processing Results and Conclusion
- Calculate the average speed for each liquid using the formula provided.
- Plot a graph of density of liquid (x-axis) against average speed (y-axis).
- Draw a line of best fit and observe the trend to determine whether and how the density of the liquid affects the average speed of the falling ball.
Plan includes ruler and stopwatch; method measures liquid height and fall time for each liquid; controls are liquid height and ball properties; table has columns for density, time and speed with units; processing involves calculating speed and plotting density against speed to find the relationship.
Walkthrough
Additional Apparatus: The question asks for the relationship between density and average speed. Speed is distance divided by time, so we need to measure both. The distance is the height of the liquid, measured with a ruler or measuring tape. The time is the duration of the fall, measured with a stopwatch or timer. These are the only two additional apparatus items required.
Method: To find the average speed, we must measure the distance the ball travels and the time it takes. The distance is the height of the liquid column in the cylinder. The ball must be dropped from rest at the surface so it travels the full height. We time the fall until it hits the bottom. Then we calculate speed. Since we are investigating different liquids, we must repeat the entire procedure for each liquid in the selection.
Control Variables: A fair test requires that only the independent variable (density of the liquid) changes. Therefore, we must control the distance the ball falls (same height or volume of liquid) and the properties of the falling object (same metal ball, ensuring same mass, volume, and shape). If we changed the ball, its terminal velocity and drag characteristics would change, ruining the test.
Results Table: The table needs columns for the independent variable (density), the raw measurement (time taken), and the derived quantity (average speed). Crucially, every column heading must include the unit of measurement. Density is typically in , time in , and speed in .
Processing and Conclusion: First, calculate the average speed for each row using the given equation. Then, plot a graph with density on the x-axis and average speed on the y-axis. Drawing a line or curve of best fit allows us to see the trend: does speed increase, decrease, or stay constant as density increases? This visual analysis justifies the final conclusion.
Key Takeaways
- A complete experiment plan must explicitly cover apparatus, method, control variables, results table, and data processing.
- Units are mandatory in all results table headings; omitting them costs a mark.
- Derived quantities (like speed) belong in a separate column from raw measurements (like time).
- Control variables must be specific to the physics of the experiment (e.g., same ball, same liquid height), not generic statements like "be careful".
Common Mistakes
- Forgetting units in the table: Writing "Density" instead of "Density / " is a frequent error that loses a mark.
- Measuring the wrong distance: Using the length of the measuring cylinder instead of the height of the liquid. The ball only falls through the liquid.
- Not repeating for all liquids: The independent variable is density, so multiple readings across different densities are required to establish a relationship.
- Stating incorrect control variables: Saying "control gravity" or "control air resistance" when the experiment is explicitly about liquid density. The relevant controls are the liquid height and the ball's properties.
Things to Be Careful About
- Precision of readings: When describing the method, note that the ruler should be read at eye level to avoid parallax error, and the stopwatch should be started and stopped precisely at the surface and bottom.
- Derived vs. raw data: Time is measured directly; speed is calculated. Do not put calculated speed in the raw data column.
- Graph axes: When plotting the graph, ensure the axes are labelled with the quantity and the unit (e.g., "density / "), not just the symbol.
- Fair test logic: Ensure every control variable directly relates to why it must be kept constant to isolate the effect of liquid density on the ball's speed.