Physics 5054/31 — May/June 2025
Cambridge O-Level · Practical Test · worked solutions for every part, with the mark scheme
Topics Analysis, Conclusions and Evaluation · Experimental Contexts · Use of Techniques, Apparatus and Materials · Observations and Measurements · Planning Experiments and Investigations
You will investigate the resistance of a lamp.
You are provided with a circuit consisting of:
- a power supply
- a lamp
- a switch in the 'off' position
- an ammeter
- a voltmeter.
You are also provided with a 10 resistor and an additional connecting lead.
The circuit shown in Fig. 1.1 has been set up for you.
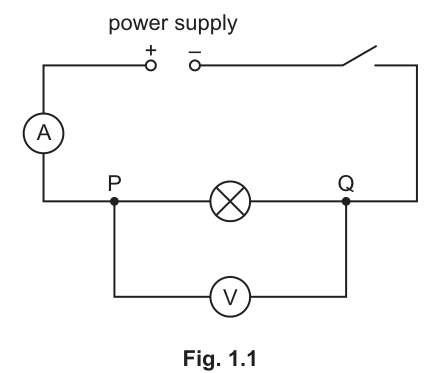
Close the switch.
Record the readings of current and potential difference .
= ______
= ______
Open the switch.
Answer
(Accept any in the range 0.20–0.40 A and in the range 2.7–2.9 V, recorded to the precision of the instruments.)
Representative values: , (accept any in range 0.20–0.40 A and in range 2.7–2.9 V)
Walkthrough
This part requires the candidate to close the switch, read the current through the lamp and the potential difference across it, and then open the switch. The readings are candidate-dependent, so any values within the acceptable ranges shown in the mark scheme score. The ammeter reading must be to the precision of the instrument (e.g. 0.01 A or 0.1 A depending on the scale), and similarly for the voltmeter.
Key Takeaways
In practical electricity, candidates must be able to read instruments accurately and record values with the correct precision. The switch must be opened promptly to avoid altering the conditions of the experiment.
Common Mistakes
- Recording readings with too many or too few decimal places (not matching the instrument's precision).
- Forgetting to open the switch after recording, which leads to the next part's reasoning.
Things to Be Careful About
On Papers 3 and 4, practical readings are never single fixed numbers. Always quote a representative value within the scheme's range and state the acceptable range. Ensure units (A and V) are included with the readings.
Suggest why you are instructed to open the switch after you have recorded the readings.
Answer
To prevent the wires from heating up and the cells (power supply) from running down.
To prevent the wires heating up and the cells from running down.
Walkthrough
When a circuit is left switched on for an extended period, current flowing through the wires causes them to heat up due to their resistance. This changes the resistance of the wires and can also cause the power supply (especially if it is a battery) to drain faster. Opening the switch immediately after taking readings minimises these effects, keeping the circuit conditions stable for subsequent measurements.
Key Takeaways
Standard practical technique: keep the switch open when not actively taking readings to maintain constant resistance and preserve the power supply.
Common Mistakes
- Writing 'safety' or 'to avoid electric shock' as the reason. The voltage here is low and safe; the issue is about maintaining experimental conditions and preserving the cells.
- Writing 'heat' instead of 'wires heating up'.
Things to Be Careful About
5054 is strict about accepting 'prevents wires heating up' or 'cells running down'. Do not just write 'safety'.
Use the equation:
to calculate the resistance of the lamp.
Give your answer to 2 significant figures.
= ______
Working
Using the representative readings from (a)(i):
Rounding to 2 significant figures:
Answer
(Calculate using the candidate's own values from (a)(i) and round to 2 significant figures.)
9.3 (calculated from representative values; accept any correct value to 2 sf based on readings in (a)(i))
Walkthrough
The resistance of the lamp is calculated using Ohm's law in the form . The candidate substitutes their recorded values of and from part (a)(i). The mark scheme awards one mark for the correct calculation based on their own readings, and a second mark for rounding the final answer to exactly 2 significant figures. For example, using and gives , which rounds to .
Key Takeaways
Candidates must apply correctly and pay attention to significant figures. The number of significant figures in the answer should match the precision of the given data (here, 2 sf is explicitly required and the readings have 2 sf).
Common Mistakes
- Forgetting to round to 2 significant figures (e.g. leaving it as 9.33).
- Using the wrong values from the table.
- Writing the unit as 'ohms' instead of the symbol '' (though usually both are accepted, the symbol is preferred).
Things to Be Careful About
Always show the substitution before giving the final answer to earn the method mark. Ensure the final answer is strictly 2 significant figures.
Disconnect the voltmeter at point P.
Add the 10 resistor into the circuit in series with the lamp and reconnect the voltmeter as shown in Fig. 1.2.
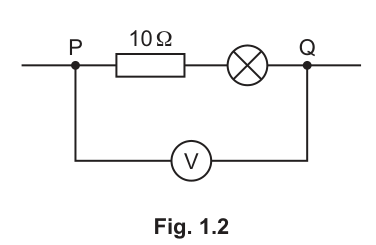
Repeat (a)(i) to find the readings of and .
Use the equation given in (a)(iii) to find the combined resistance of the lamp and the resistor connected in series.
= ______
= ______
= ______
Answer
Working
Answer
(Accept any in range 0.08–0.28 A and in range 2.7–2.9 V. must be calculated correctly from the candidate's values and be higher than the value found in (a)(iii).)
Representative values: , , (accept any in range 0.08–0.28 A and in range 2.7–2.9 V, with calculated correctly and higher than (a)(iii))
Walkthrough
The 10 resistor is added in series with the lamp. The total resistance of the circuit increases, so the current decreases. The voltmeter now measures the total potential difference across both the resistor and the lamp. The candidate records the new current and voltage , then calculates the combined resistance . Because the total resistance is now the sum of the lamp's resistance and the 10 resistor, must be higher than the resistance of the lamp alone found in (a)(iii).
Key Takeaways
Adding a resistor in series increases the total resistance and reduces the current. The voltmeter now reads the combined p.d. across both components.
Common Mistakes
- Forgetting that must be higher than from (a)(iii).
- Calculating incorrectly or not rounding appropriately.
Things to Be Careful About
The mark scheme explicitly requires to be higher than the value in (a)(iii). If a candidate's readings give a lower value, they may lose the second mark for this part. Ensure readings are consistent with an increased total resistance.
Theory states that the value of the resistance of the lamp in the circuit shown in Fig. 1.2 is given by:
Find the resistance of the lamp predicted by theory.
predicted = ______
Working
Using the formula from the question and the candidate's value for :
Answer
predicted
(Calculate using the candidate's own value from (b)(i).)
6 (calculated from candidate's value in (b)(i) using )
Walkthrough
In a series circuit, the total resistance is the sum of the individual resistances: . Rearranging this gives the predicted resistance of the lamp as . The candidate simply subtracts 10 from their calculated value of .
Key Takeaways
For resistors in series, . This allows the resistance of an unknown component to be found if a known resistor is added in series.
Common Mistakes
- Adding 10 instead of subtracting.
- Using a value for that was not calculated from their own readings in (b)(i).
Things to Be Careful About
This is an 'error carried forward' (ecf) mark. The candidate must use their own value of from part (b)(i), even if it was incorrect, as long as the subtraction is done correctly.
Use your values of the current in the circuits and any observations about the brightness of the lamp to explain why the value of in (b)(ii) is lower than in (a)(iii).
Answer
In the circuit in Fig. 1.2, the lamp is dimmer than in Fig. 1.1. This is because the combined resistance is higher, so the current in the lamp (and the circuit) is lower. The lower current means the lamp does not get as hot. Since the resistance of a lamp filament increases as its temperature increases, the cooler lamp has a lower resistance.
Answer
- Lamp is dimmer (in Fig. 1.2).
- Lower current (in the lamp / circuit) so the lamp does not get as hot.
- Lower resistance of the lamp because it is cooler.
The lamp is dimmer because the current is lower (due to higher total resistance). The lower current means the lamp does not get as hot, and since resistance increases with temperature, the cooler lamp has a lower resistance.
Walkthrough
The question asks why the predicted in (b)(ii) (which is lower) is lower than the measured in (a)(iii). The key observation is the brightness of the lamp. In Fig. 1.2, the 10 resistor is in series, increasing the total resistance and reducing the current. The reduced current makes the lamp dimmer. A dimmer lamp means it is cooler (less thermal energy is being generated). The resistance of a tungsten filament is not constant; it increases significantly as the temperature rises. Therefore, the cooler lamp in Fig. 1.2 has a lower resistance than the hotter lamp in Fig. 1.1.
Key Takeaways
The resistance of a lamp filament is temperature-dependent. Higher current -> hotter filament -> higher resistance. Lower current -> cooler filament -> lower resistance.
Common Mistakes
- Saying 'resistance is lower because there is less voltage'. (The voltage across the lamp is actually lower, but the fundamental reason is the temperature change).
- Not mentioning the observation of brightness or temperature.
- Writing 'heat' instead of 'thermal energy' or 'temperature'.
Things to Be Careful About
The explanation requires a causal chain: higher total resistance -> lower current -> dimmer lamp -> cooler filament -> lower resistance. Each link is a separate mark. Ensure the candidate mentions the brightness/temperature observation, as this is what justifies the conclusion.
You will investigate the light reflected from a plane mirror.
You are provided with:
- a plane mirror in a holder
- a slit cut into card and a lamp to illuminate it, or a ray box and a single slit
- a protractor
- a 30 cm ruler.
Fig. 2.1 shows a straight line AB.
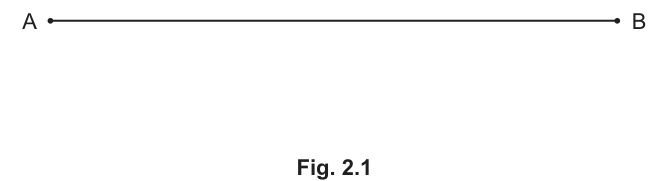
Draw a line from point A at an angle of in an anticlockwise direction from AB.
This line should be more than 10 cm long.
Label the end of the line as point C.
Answer
A line drawn from A at 30° to AB, longer than 10 cm, labelled C.
Line drawn at 30° to AB, >10 cm long, labelled C
Walkthrough
Use a protractor to measure 30° anticlockwise from AB at point A. Draw a straight line from A through this mark using a ruler. Ensure the line is visibly longer than 10 cm (use the 30 cm ruler to check) and label the far end C.
Key Takeaways
Basic construction of ray diagrams using a protractor and ruler.
Common Mistakes
Drawing the angle in the wrong direction (clockwise instead of anticlockwise). Forgetting to label the end of the line as C.
Things to Be Careful About
Ensure the protractor is aligned correctly with AB and that the angle is measured from the correct side. The line must be clearly longer than 10 cm.
Mark a point D on the line AB, 4.0 cm from point A.
Draw a line perpendicular to AB through point D.
This line must also pass through the line AC that you have drawn in part (a)(i).
Label, with an E, the point where the line through point D passes through AC.
Answer
Point D marked 4.0 cm from A on AB. Normal line drawn perpendicular to AB through D, intersecting AC at E.
Normal line drawn 4.0 cm from A, intersecting AB at D and AC at E
Walkthrough
Use the ruler to measure 4.0 cm from A along AB and mark point D. Use a protractor or set square to draw a line through D perpendicular to AB. Extend this line until it crosses AC and label the intersection E.
Key Takeaways
Constructing a normal (perpendicular) to a surface in optics experiments.
Common Mistakes
Measuring from B instead of A. Forgetting to label both intersection points D and E.
Things to Be Careful About
Ensure the perpendicular is truly 90° to AB. The line should extend above and below AB to clearly show the intersections.
Place the front surface of the mirror along the line AC on Fig. 2.1 with the reflective surface facing point B.
Using the illuminated slit, pass a ray of light along the line DE towards the mirror. The ray should reflect from the mirror.
Mark with crosses (X) two points on the reflected ray.
Label these points and .
Answer
Two points P1 and P2 marked with crosses on the reflected ray.
Two points P1 and P2 marked on the reflected line
Walkthrough
Place the mirror along AC with the reflective side facing B. Shine the light along DE. Observe the reflected ray. Mark two distinct points on this reflected ray using crosses and label them P1 and P2.
Key Takeaways
Locating a ray's path by marking two points.
Common Mistakes
Marking points too close together. Not placing the mirror correctly along AC.
Things to Be Careful About
Ensure the mirror's front surface is exactly on AC. Mark clearly with crosses.
Remove the mirror.
Draw a line through points and and extend it to meet line AC.
This is the reflection of the line DE.
Answer
Line drawn through P1 and P2, extended to meet AC.
Line drawn through P1 and P2, extended to meet AC
Walkthrough
Remove the mirror. Use a ruler to draw a straight line through P1 and P2. Extend this line until it intersects AC. This represents the reflected ray.
Key Takeaways
Reconstructing a ray path from marked points.
Common Mistakes
Not extending the line to meet AC. Drawing a curved line instead of straight.
Things to Be Careful About
Use a sharp pencil and a ruler to ensure the line is straight and accurately passes through P1 and P2.
Answer
Points P1 and P2 are chosen to be at least 4 cm apart (or further apart).
Points at least 4 cm apart
Walkthrough
To minimize the angular error when drawing the line through P1 and P2, the points should be as far apart as possible. The mark scheme accepts at least 4 cm apart.
Key Takeaways
Practical techniques to improve accuracy in ray tracing.
Common Mistakes
Saying 'use a sharp pencil' without explaining why, or not specifying a distance.
Things to Be Careful About
The question asks how the points are chosen, not what apparatus is used. Focus on the spacing between P1 and P2.
Answer
θ = 60°
60
Walkthrough
The angle of incidence is 30° (between DE and the normal). By the law of reflection, the angle of reflection is also 30°. The angle θ is between the mirror surface (CE) and the reflected ray (EP1). Since the normal is 90° to the mirror, θ = 90° - 30° = 60°. Acceptable range is 58° to 62°.
Key Takeaways
Applying the law of reflection and measuring angles in ray diagrams.
Common Mistakes
Measuring the angle of reflection instead of θ. Forgetting to measure from the mirror surface.
Things to Be Careful About
Ensure the protractor is correctly aligned with CE and EP1. Read to the nearest degree.
Fig. 2.2 shows a second line labelled .
On Fig. 2.2, draw a line from point at an angle of in an anticlockwise direction from line .
This line should be more than 10 cm long.
Label the end of the line with a .
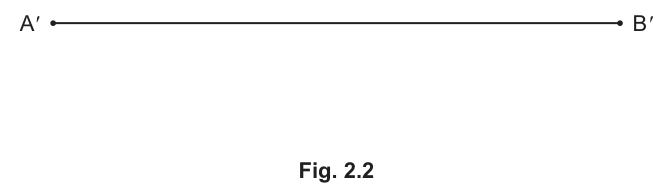
Mark a point on the line , 4.0 cm from point .
Draw a line perpendicular to through point .
This line must also pass through the line that you have drawn.
Label the point where the line through point passes through with an .
Place the front surface of the mirror along the line on Fig. 2.1, with the reflective surface facing point .
Using the illuminated slit, pass a ray of light along the line towards the mirror. The ray should reflect from the mirror.
Mark with crosses (X) two points on the reflected ray.
Label these points and .
Remove the mirror.
Draw a line through points and and extend it to meet line .
This is the reflection of the line .
Answer
All steps from (a) and (b) repeated correctly for Fig. 2.2 with a 60° line.
Steps repeated correctly for Fig. 2.2
Walkthrough
Follow the exact same procedure as in parts (a) and (b), but using Fig. 2.2 and a 60° angle for A'C'. Mark points P3 and P4 on the new reflected ray and draw the reflected line.
Key Takeaways
Repeating experiments to gather more data.
Common Mistakes
Not following the same procedure. Forgetting to label the new points P3 and P4.
Things to Be Careful About
Ensure the 60° angle is measured correctly anticlockwise from A'B'.
Answer
α = 30°
30
Walkthrough
The angle of incidence is 60° (between D'E' and the normal). By the law of reflection, the angle of reflection is 60°. The angle α is between the mirror surface (C'E') and the reflected ray (E'P3). Since the normal is 90° to the mirror, α = 90° - 60° = 30°. Acceptable range is 28° to 32°.
Key Takeaways
Measuring angles in ray diagrams for different incidence angles.
Common Mistakes
Measuring the angle of reflection instead of α.
Things to Be Careful About
Ensure the protractor is correctly aligned with C'E' and E'P3.
Assume that the line has been drawn accurately.
State one practical precaution, other than your answer to (b)(iii), that you take to ensure that the drawn angle can be measured accurately.
Answer
Use a sharp pencil to mark the angles, or describe placing the protractor's center exactly on the vertex and aligning the baseline with one ray.
Use a sharp pencil or correct protractor alignment
Walkthrough
To measure the angle accurately, use a sharp pencil so the marks are fine. When using the protractor, ensure the center hole is exactly on the vertex (E') and the baseline is aligned with one of the rays (e.g., C'E').
Key Takeaways
Techniques for accurate angle measurement.
Common Mistakes
Saying 'use a better protractor' without explanation. Not describing the actual technique.
Things to Be Careful About
The question asks for a precaution other than spacing points apart. Focus on the measurement technique itself.
Theory suggests that:
where is the answer to (b)(iv) and is the answer to (c)(ii).
State whether your results support this theory.
Give a reason for your answer.
Answer
Yes, the results support the theory because θ (60°) is approximately equal to 2α (2 × 30° = 60°), within experimental error.
OR
No, the results do not support the theory because the values are too far apart (e.g., if θ = 55° and α = 35°, 2α = 70° which is not close to 55°).
Yes, values are very close / within experimental error
Walkthrough
Calculate 2α using the measured value of α. Compare this to the measured value of θ. If they are very close (within ±2°), the results support the theory θ = 2α. If they are significantly different, they do not. In this ideal case, θ = 60° and 2α = 60°, so they match perfectly.
Key Takeaways
Evaluating experimental data against a theoretical prediction.
Common Mistakes
Saying 'yes' without giving a reason. Not calculating 2α to compare with θ.
Things to Be Careful About
Always quote the actual values measured in your reason. If the values don't match, explain that experimental error could be the cause, but state clearly whether they support the theory or not based on the data.
You will investigate the time taken for water to flow through a small hole in the bottom of a can.
You are provided with:
- a clamp, boss and stand
- a can with a small hole at the bottom
- a supply of water in a 250 beaker labelled 'supply of water'
- a 50 measuring cylinder
- a 100 measuring cylinder
- a funnel
- a stopwatch
- paper towels to mop up spillage.
Some of the apparatus has been arranged for you as shown in Fig. 3.1.
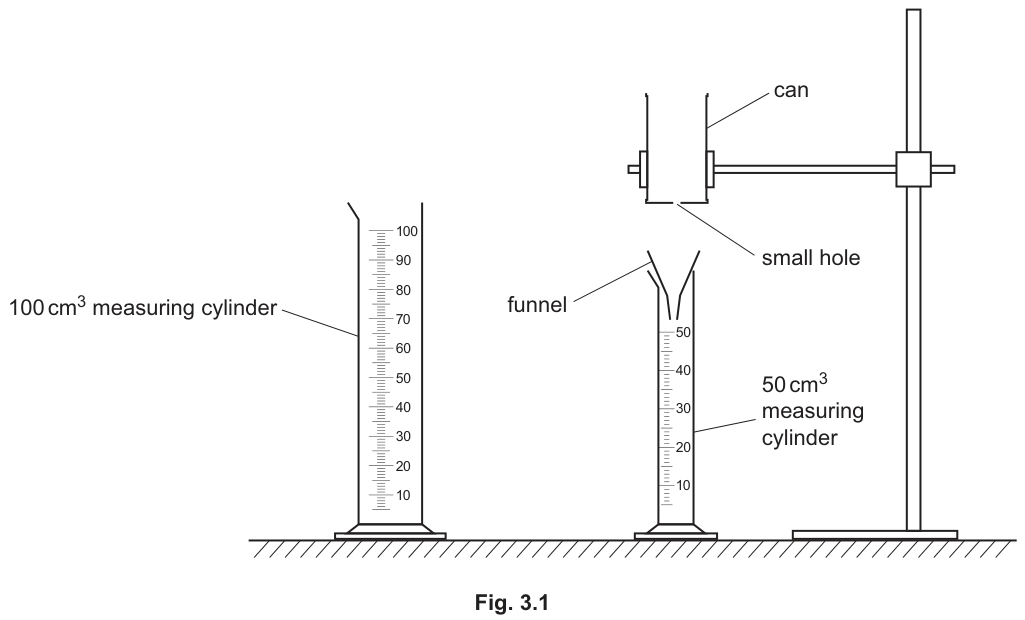
Use the 100 measuring cylinder to measure a volume of water.
Hold your finger under the hole at the bottom of the can. Pour the volume of water into the can.
Remove your finger and start the stopwatch immediately.
Stop the stopwatch when the volume of water in the 50 measuring cylinder is 30 .
Put your finger back over the hole in the bottom of the can.
Unclamp the can and empty the water remaining in it, and the water in the measuring cylinder, back into the beaker labelled 'supply of water'.
The reading on the stopwatch is time .
Record .
= ______
Answer
= 21.0 s
(Any value between 18.0 s and 24.0 s to at least 0.1 s is accepted.)
21.0 s (any value between 18.0 s and 24.0 s to 0.1 s)
Walkthrough
The candidate must perform the experiment as described. They measure 70 cm³ of water, fill the can, and time how long it takes for 30 cm³ to flow out into the measuring cylinder. The stopwatch is read to the nearest 0.1 s. A typical reading falls in the range 18.0 s to 24.0 s.
Key Takeaways
- Stopwatches on the Cambridge syllabus are read to 0.1 s.
- In unfamiliar practical procedures, follow the instructions exactly and record the raw reading before any calculation.
Common Mistakes
- Recording the time to the nearest second instead of 0.1 s (e.g. writing 21 instead of 21.0).
- Starting the stopwatch late or stopping it early, leading to a value outside the acceptable range.
Things to Be Careful About
- Always include the trailing zero to show the precision of the reading (21.0 s, not 21 s).
- The value is candidate-dependent; any reading between 18.0 s and 24.0 s is valid for marking purposes.
Repeat (a)(i) one more time. Record the time as .
Find the average time of and .
Give your answer to the nearest 0.1 s.
= ______
= ______
Answer
= 22.0 s
= 21.5 s
(Values must be consistent with from (a)(i) and averaged correctly to 0.1 s.)
t_2 = 22.0 s, t_{av} = 21.5 s (values consistent with t_1 from (a)(i), average to 0.1 s)
Walkthrough
The candidate repeats the measurement to check for consistency. They record a second time , then calculate the average: . The result must be given to 0.1 s.
Key Takeaways
- Repeating measurements allows the identification of anomalies and improves reliability.
- Averages should be reported to the same decimal place as the raw readings.
Common Mistakes
- Rounding the average incorrectly (e.g. 21.45 rounded to 21.4 instead of 21.5, or rounding to 1 decimal place when the scheme requires it).
- Forgetting to include the unit in the final answer if required (though the blank is pre-filled with 's').
Things to Be Careful About
- Ensure is a realistic value close to . If is wildly different (e.g. 35 s), the average will be poor and may not score.
- The average must be to 0.1 s, matching the precision of the stopwatch.
The average flow rate is given by:
Calculate and give the unit of your answer.
= ______ unit ______
Working
Using s from (a)(ii):
Answer
= 1.4 unit cm³ / s
(Value is error carried forward from in (a)(ii). Unit must be cm³ / s.)
R = 1.4, unit cm³ / s (value depends on t_{av} from (a)(ii))
Walkthrough
The flow rate is the volume of water collected divided by the time taken. The volume collected is 30 cm³ (as stated in the procedure: 'Stop the stopwatch when the volume of water in the 50 cm³ measuring cylinder is 30 cm³'). The time is the average time calculated in part (a)(ii). The unit is volume per time, which is cm³ / s.
Key Takeaways
- Flow rate is a derived quantity: volume divided by time.
- Always use the average time , not individual times or .
Common Mistakes
- Using 70 cm³ (the initial volume in the can) instead of 30 cm³ (the volume collected in the measuring cylinder) in the calculation.
- Forgetting the unit or writing an incorrect unit such as cm³ s or s / cm³.
- Not giving the answer to a sensible number of significant figures (2 or 3 is appropriate here).
Things to Be Careful About
- The mark scheme awards error carried forward (ecf) from the candidate's . If they used 20.0 s, cm³ / s would still score.
- The unit blank is separate; ensure both the number and the unit are clearly stated.
Repeat (a)(i) and (a)(ii) for values of , 90 , 80 , 60 and 50 .
Record all your results, including those you obtained for volume in (a)(i) and (a)(ii), in Table 3.1.
Calculate for each value of volume and enter your answers into Table 3.1.
Complete Table 3.1 by writing appropriate headings, with units, in the top row.
Table 3.1
| ______ | ______ | ______ | |
|---|---|---|---|
| 100 | |||
| 90 | |||
| 80 | |||
| 70 | |||
| 60 | |||
| 50 |
Answer
| / cm³ | / s | / s | / s |
|---|---|---|---|
| 100 | 32.0 | 33.0 | 32.5 |
| 90 | 29.0 | 28.5 | 28.8 |
| 80 | 26.0 | 25.5 | 25.8 |
| 70 | 21.0 | 22.0 | 21.5 |
| 60 | 19.0 | 18.5 | 18.8 |
| 50 | 16.0 | 16.5 | 16.3 |
(Headings and units must be correct. Readings should show increasing as decreases. Averages to 0.1 s.)
See completed table with headings V / cm³, t₁ / s, t₂ / s, t_{av} / s and consistent trend of increasing t_{av} as V decreases.
Walkthrough
The candidate repeats the experiment for different initial volumes (100, 90, 80, 60, 50 cm³). For each, they record and , then calculate . The table must have correct headings including units. The trend must be logical: as the volume in the can decreases, the pressure at the hole decreases, so the flow rate decreases and the time to collect 30 cm³ increases. Thus, should increase as decreases.
Key Takeaways
- Results tables must have headings that include both the quantity and its unit (e.g., / cm³).
- Averages should be calculated to the same decimal place as the raw data (0.1 s).
- The trend in the data must be physically sensible.
Common Mistakes
- Forgetting the units in the table headings (e.g., writing just '' instead of ' / s').
- Calculating averages incorrectly or to the wrong number of decimal places.
- Recording readings that do not show the correct trend (e.g., time decreasing as volume decreases).
- Not repeating the measurement for each volume (only recording one time instead of and ).
Things to Be Careful About
- The table has 4 columns. The first is , the next three must be , , and with units.
- Ensure the values for cm³ match those recorded in part (a).
- All readings must be consistent with the stopwatch precision (0.1 s).
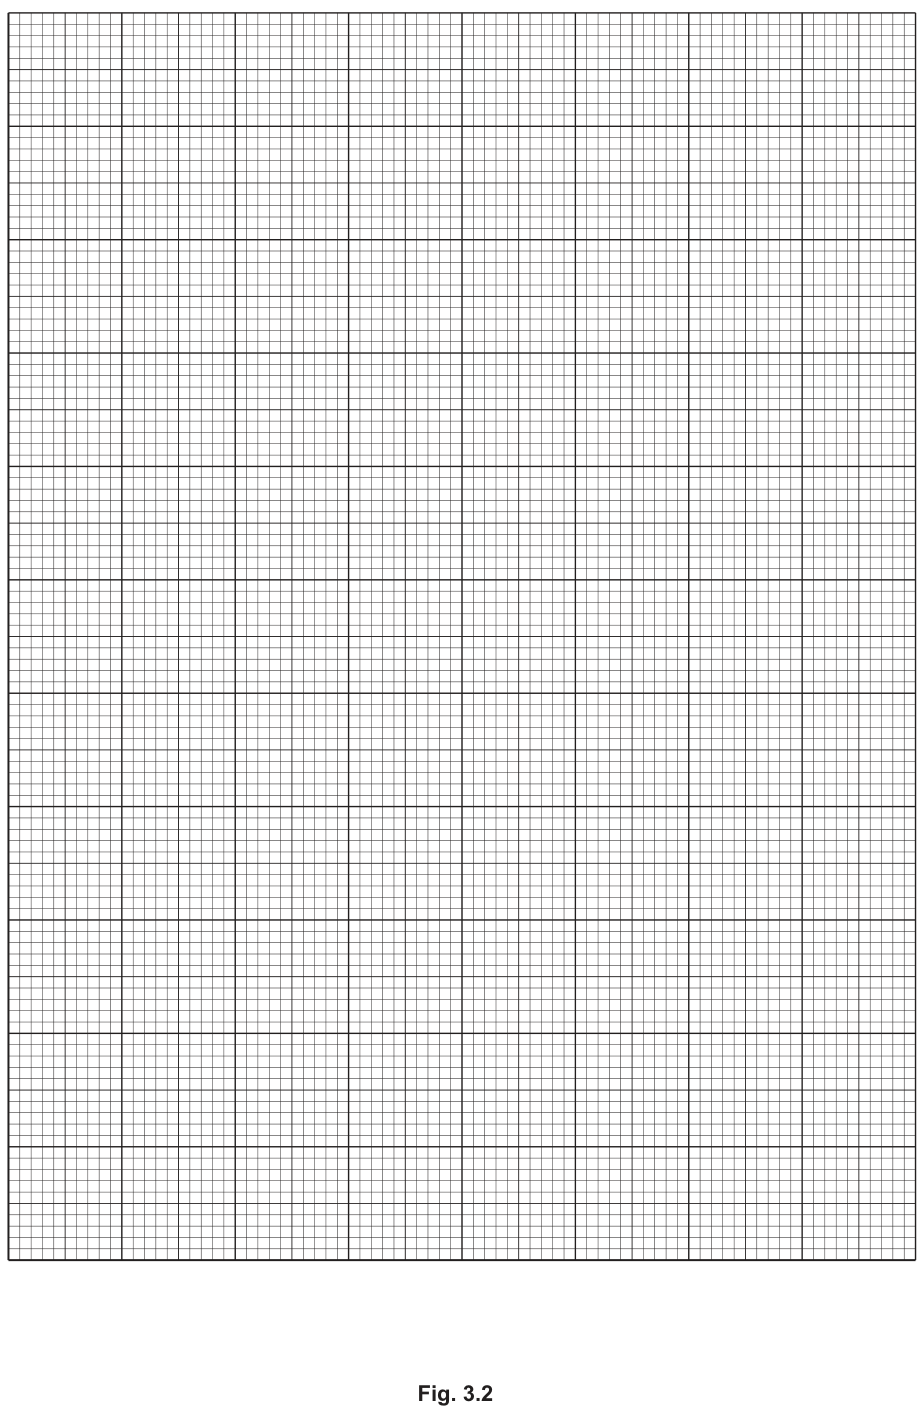
On the grid provided in Fig. 3.2, plot a graph of on the y-axis against on the x-axis.
You do not need to start your axes at (0, 0).
Draw the curve of best fit.
Answer
(Graph of on y-axis against on x-axis. Axes labelled with quantity and unit. Scales linear and not awkward. Points plotted accurately. Thin curved line of best fit drawn.)
Graph with correct axes, scales, plotted points, and curved best-fit line. See diagram.
Walkthrough
The candidate plots (y-axis) against (x-axis). The x-axis ranges from 50 to 100 cm³. The y-axis ranges from approximately 15 to 35 s. Points are plotted to within half a small square. A line of best fit is drawn. Because the flow rate is not constant (it decreases as the water level drops and pressure decreases), the graph is not a straight line; it is a curve. The curve should be smooth and balanced.
Key Takeaways
- The independent variable () goes on the x-axis, the dependent variable () on the y-axis.
- Axes must be labelled with the quantity and the unit (e.g., / s).
- Scales should use at least half the grid and be linear and not awkward (e.g., avoid 3, 7, or 13 to the large square).
- Points must be plotted accurately, to the nearest half square.
- The line of best fit should be thin and smooth. For this experiment, a curve is expected because the pressure (and thus flow rate) changes as water flows out.
Common Mistakes
- Swapping the axes (plotting against ).
- Starting axes at (0, 0) when not necessary (the scheme says 'You do not need to start your axes at (0, 0)').
- Drawing a straight line instead of a curve.
- Plotting points inaccurately (more than half a square off).
- Using a thick line or a ruler for a curve.
Things to Be Careful About
- The line of best fit does not need to pass through every point; it should balance the points on either side.
- The curve should not be drawn through the points like a join-the-dots line; it must be a smooth curve that represents the trend.
Answer
The time taken would be too long, or there might not be enough water (pressure) in the can for the water to continue flowing.
(Any one valid point.)
The time taken would be too long, or there might not be enough water (pressure) in the can for the water to continue flowing.
Walkthrough
The question asks why values of below 50 cm³ are not measured. If the initial volume is very small (e.g., 40 cm³), the water level in the can is low, meaning the hydrostatic pressure at the hole is small. This results in a very slow flow rate, so it would take a very long time to collect 30 cm³. Alternatively, if the volume is too small, the water might stop flowing before 30 cm³ is collected because the water level drops below the hole.
Key Takeaways
- The flow rate through a hole depends on the pressure, which depends on the height of water above the hole.
- As water flows out, the pressure decreases, and the flow rate slows down.
- Practical limits of apparatus must be considered in experimental design.
Common Mistakes
- Saying 'the water will run out' without explaining why (it's about the pressure/height of water).
- Saying 'it will take too long' without linking it to the low pressure or small volume.
- Vague answers like 'it is inaccurate' or 'human error'.
Things to Be Careful About
- The answer must be a physical reason related to the apparatus or the fluid dynamics (pressure/flow rate), not a general experimental error.
- 'Pressure' is a key word here; low volume means low pressure, which means slow flow.
On your graph, sketch the line you would expect to see if the small hole in the can is made slightly bigger. Label this line L.
Answer
(A curved line below the plotted line for the entire range, labelled L.)
Curved line below the plotted line (for the entire range) and labelled L.
Walkthrough
If the hole is made slightly bigger, the flow rate will increase for any given volume of water. This means the time to collect 30 cm³ will be less. Therefore, on the graph of against , the new line must be below the original line for all values of . The shape will still be a curve, but shifted downwards. The line must be labelled 'L'.
Key Takeaways
- A larger hole allows water to flow faster, reducing the time taken.
- On a graph of time against volume, a faster flow rate corresponds to a lower time value for the same volume.
- The new line should have a similar shape (curved) but be positioned below the original.
Common Mistakes
- Drawing the line above the original line (thinking a bigger hole means more time, which is incorrect).
- Drawing a straight line instead of a curve.
- Not labelling the new line 'L'.
- Only drawing the line for part of the range (it should be for the entire range of V).
Things to Be Careful About
- The line must be below the original curve for all values of V from 50 to 100 cm³.
- Ensure the line is clearly labelled 'L' as requested.
- The line should be a sketch, not a precise calculation, but must be physically correct.
When a table tennis ball is dropped as shown in Fig. 4.1, it will bounce back upwards. Some of the initial gravitational potential energy (GPE) of the ball is lost in the bounce.
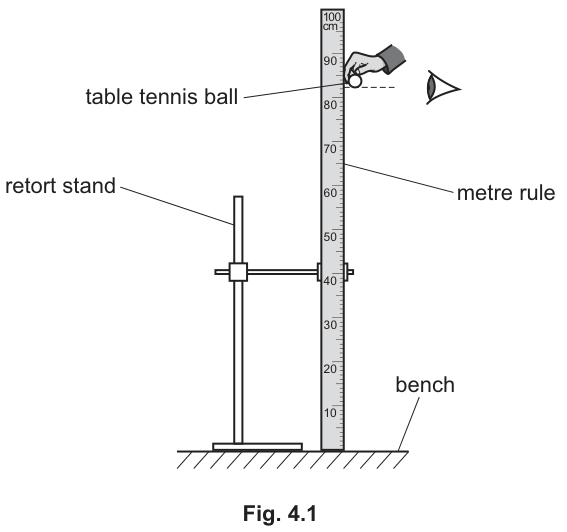
Plan an experiment to investigate how the height from which the ball is dropped affects the percentage of GPE lost in each bounce.
You may use any apparatus commonly found in a school laboratory in addition to the apparatus shown in Fig. 4.1.
GPE is given by the equation:
where is the mass of the ball, is the gravitational field strength and is the height above the bench from which the ball is dropped.
You are not required to do this experiment.
In your plan, you should:
- state what you will measure (dependent variable) and any additional apparatus you may use
- state any key variables to keep constant
- explain how you will ensure the results are as accurate as possible
- draw a table with column headings to display the results
- explain how you will use the results to draw a conclusion.
Answer
Method and Apparatus:
- Drop the table tennis ball from a measured height using the metre rule and measure the maximum height it reaches after the first bounce.
- Use a top pan balance to measure the mass of the ball (required if using directly, though mass cancels in the percentage calculation).
- Repeat the measurements for at least five different drop heights to obtain a range of results.
Control Variables:
- Keep the mass of the ball constant (use the same table tennis ball).
- Keep the nature of the rebound surface constant (always drop onto the same bench).
Accuracy:
- Read the heights to the nearest 0.1 cm (1 mm) by ensuring the eye is level with the bottom of the ball.
- Repeat the rebound height measurement for each drop height and calculate an average to reduce random errors.
Results Table:
| Drop height / cm | Rebound height / cm | Percentage of GPE lost / % |
|---|---|---|
Conclusion:
- Calculate the percentage of GPE lost for each drop height using the formula: .
- Compare the percentage values across the different drop heights to determine if the percentage of GPE lost changes with drop height, or plot a graph of percentage loss against drop height to look for a trend.
See working
Walkthrough
This is a Paper 3 planning question worth 6 marks, structured around six distinct marking points (MP1 to MP6). The candidate must design an experiment to investigate how drop height affects the percentage of gravitational potential energy (GPE) lost during a bounce.
MP1: Method. The core of the experiment is measuring two heights: the initial drop height and the maximum rebound height after the first bounce. The metre rule provided in Fig. 4.1 is used for both measurements. The candidate must state that these heights are measured.
MP2: Additional apparatus. The mark scheme specifically credits a (top pan) balance to find the mass of the ball. While it is true that mass cancels out when calculating the percentage of GPE lost (), older or specific mark schemes still award the mark for identifying the balance because the question introduces the formula . Always follow the mark scheme's explicit credit here.
MP3: Repeats and range. A valid scientific investigation requires more than a single data point. The candidate must state that the experiment is repeated for different (at least five) drop heights to establish a relationship or trend.
MP4: Control variables. To ensure a fair test, variables other than the drop height must be kept constant. The most critical ones are the mass and material of the ball (use the same ball) and the surface it bounces on (the bench). Changing the surface would change the energy lost to deformation and sound.
MP5: Results table. The table must have clear column headings that include both the physical quantity and its unit. The primary measurements are drop height and rebound height. A third column for the calculated percentage of GPE lost is necessary for the conclusion.
MP6: Conclusion. The candidate must explain how the data will be used. Since the independent variable is drop height and the dependent variable is the percentage of GPE lost, the conclusion involves calculating this percentage for each row and either comparing the values directly or plotting a graph (percentage lost on the y-axis, drop height on the x-axis) to identify any trend.
Key Takeaways
- Planning questions require a structured approach covering method, apparatus, variables, accuracy, data recording, and analysis.
- Even when a quantity cancels out algebraically (like mass in a percentage energy calculation), mark schemes may still credit its measurement if the question explicitly provides the formula involving it.
- Control variables must be specific to the physical situation (same ball, same surface) rather than vague statements like "keep conditions the same".
Common Mistakes
- Vague apparatus: Simply writing "ruler" when a metre rule is already provided, or forgetting to mention the balance when the mark scheme explicitly credits it.
- Missing units in the table: Column headings must include units (e.g., "Drop height / cm"), not just quantity names.
- Incorrect conclusion method: Stating "find the average" is not a valid conclusion for this investigation, as the goal is to see how the percentage changes with height, not to find a single average value. Stating "see if there is a correlation" is too vague; the candidate must specify calculating the percentage or plotting a graph.
- Ignoring the rebound surface: Failing to identify the surface as a control variable is a common error; the material of the surface significantly affects energy loss.
Things to Be Careful About
- Precision of readings: The metre rule in Fig. 4.1 has mm graduations. Readings should be quoted to the nearest 0.1 cm (1 mm), including a trailing zero where appropriate (e.g., 45.0 cm, not 45 cm).
- Eye level: When reading the rebound height, the candidate should mention reading at eye level with the bottom of the ball to avoid parallax error, which earns accuracy marks in similar practical questions.
- Percentage calculation: Ensure the formula for percentage loss is correctly derived or stated. The loss is , and the percentage is . Do not divide by the rebound height or use the wrong base.