Physics 5054/42 — October/November 2024
Cambridge O-Level · Alternative to Practical · worked solutions for every part, with the mark scheme
Topics Experimental Contexts · Use of Techniques, Apparatus and Materials · Observations and Measurements · Analysis, Conclusions and Evaluation · Planning Experiments and Investigations
A student determines an approximate value for the density of the glass from which a test-tube is made.
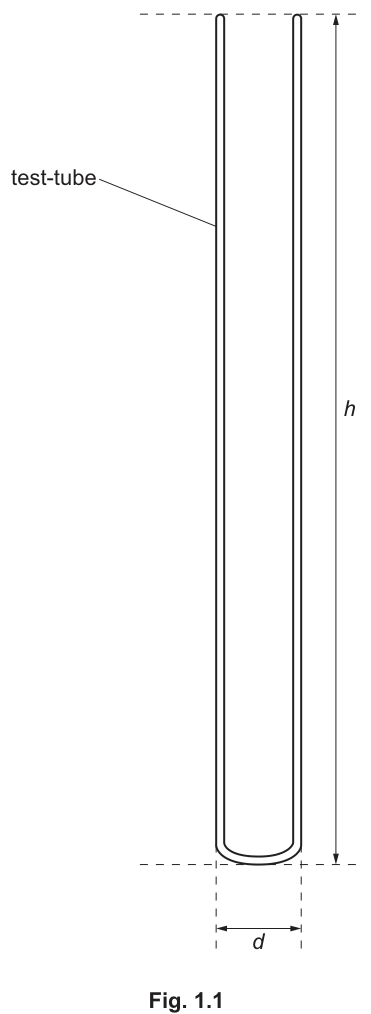
The height and the external diameter of the test-tube are shown in a full-size diagram of the test-tube in Fig. 1.1.
Answer
15.0
15.0 cm
Walkthrough
The student is given a full-size diagram of the test-tube (Fig. 1.1) and must measure the height using a ruler. In a real Paper 4 exam, the candidate places a ruler along the dimension arrow labeled and reads the value. The mark scheme specifies the value as 15.0 cm. The question asks for the reading to the nearest 0.1 cm, so a trailing zero is required to show the precision.
Key Takeaways
When measuring from a full-size diagram in Paper 4, always use a ruler and read to the precision demanded by the question. A trailing zero is significant and indicates the precision of the measurement.
Common Mistakes
- Forgetting the unit (cm).
- Not writing the trailing zero (e.g. 15 instead of 15.0), which fails the precision requirement.
- Reading the wrong dimension (e.g. reading the diameter instead of the height).
Things to Be Careful About
The question asks for the answer to the nearest 0.1 cm. This means the answer must have one decimal place. 15.0 is correct; 15 is not.
Answer
1.5
1.5 cm
Walkthrough
The student measures the external diameter of the test-tube from Fig. 1.1. The mark scheme gives the value as 1.5 cm. The question does not specify a decimal precision here, but typically a ruler reading in cm is to 0.1 cm. The value 1.5 cm is consistent with the mark scheme.
Key Takeaways
Always read the dimension asked for. The external diameter is the full width across the outside of the tube.
Common Mistakes
- Reading the internal diameter instead of the external diameter.
- Forgetting the unit.
Things to Be Careful About
Ensure the ruler is aligned with the dimension arrow labeled at the bottom of the diagram.
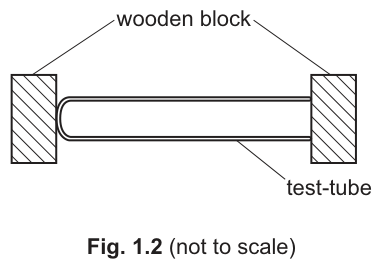
The student uses a ruler and two wooden blocks to help obtain an accurate answer for the height .
Fig. 1.2 shows how the student uses the wooden blocks.
Explain why it is important for the student to ensure that the blocks are parallel to one another.
Answer
If the blocks are not parallel, the distance between them is not constant, so the measured height would vary and not represent the true height of the test-tube.
If the blocks are not parallel, the distance between the blocks will not be constant / h varies
Walkthrough
Fig. 1.2 shows the test-tube placed horizontally between two wooden blocks to measure its height (which is the length of the tube when horizontal). The blocks act as stops against a ruler. If the blocks are not parallel to each other, the gap between them is not uniform along the length of the test-tube. This means the distance measured against the ruler would depend on where exactly the test-tube is positioned between the blocks, leading to an inaccurate or varying reading for . Ensuring they are parallel guarantees a constant distance equal to the length of the test-tube.
Key Takeaways
When using blocks as stops to measure length, they must be parallel to ensure the distance between them is constant and equal to the object's length.
Common Mistakes
- Saying "to make it accurate" without explaining why.
- Saying "to stop the tube moving" (the blocks stop it, but parallelism is about the distance being constant).
Things to Be Careful About
The mark scheme looks for the link between non-parallel blocks and a varying/non-constant distance. Use the phrase "distance will not be constant" or "h varies".
The shape of the test-tube is approximately a cylinder.
Calculate the external volume of the test-tube using the equation:
= ______
Working
Answer
26.66 (or 26.7)
26.66 cm^3
Walkthrough
The test-tube is approximated as a cylinder. The formula for the external volume is given as . This is derived from the volume of a cylinder , rounded to 0.79.
Substitute the measured values: cm and cm.
cm.
The mark scheme accepts 26.66(25), so 26.66 or 26.7 are fine.
Key Takeaways
Always use the specific formula given in the question. Be careful with squaring the diameter.
Common Mistakes
- Using radius instead of diameter (the formula uses , not ).
- Calculation errors with decimals.
- Forgetting the unit cm.
Things to Be Careful About
The coefficient 0.79 is an approximation of . Do not use unless asked; use the given 0.79. Keep extra digits in intermediate calculations to avoid rounding errors.
The student:
- fills the test-tube to the top with water
- pours the water from the test-tube into a measuring cylinder.
Fig. 1.3 shows the measuring cylinder.
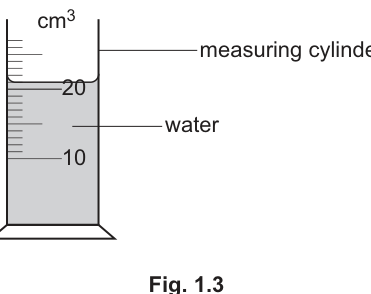
Record the reading on the measuring cylinder.
This is the internal volume of the test-tube.
= ______
Answer
21
21 cm^3
Walkthrough
The student pours the water from the test-tube into a measuring cylinder (Fig. 1.3). The mark scheme gives the reading as 21 cm. In the diagram, the scale shows 10 and 20 with subdivisions of 1 cm. The bottom of the meniscus is at the line just above 20, which is 21 cm.
Key Takeaways
When reading a measuring cylinder, always read the bottom of the meniscus at eye level. The precision is determined by the smallest division on the scale.
Common Mistakes
- Reading the top of the meniscus.
- Misreading the scale (e.g. reading 19 or 22).
- Forgetting the unit.
Things to Be Careful About
The mark scheme gives 21. Ensure you read to the nearest 1 cm as implied by the scale divisions.
Working
Answer
5.66 (or 5.7)
5.66 cm^3
Walkthrough
The volume of the glass is the difference between the external volume (the space the test-tube occupies) and the internal volume (the capacity of the test-tube).
cm.
The mark scheme accepts 5.7, 5.66, 5.662, or 5.6625. 2 or 3 significant figures is appropriate here.
Key Takeaways
The volume of the material is the external volume minus the internal volume (capacity).
Common Mistakes
- Adding the volumes instead of subtracting.
- Carrying forward rounding errors from part (c).
Things to Be Careful About
Use the unrounded value from part (c) (26.6625) to avoid rounding errors in the final density calculation.
Answer
Any one of:
- Water spilled when transferring from test-tube to measuring cylinder.
- Water remaining stuck to the sides of the test-tube or measuring cylinder.
- Cannot tell exactly when the test-tube is full (surface tension/meniscus at the rim).
- The measuring cylinder only reads to the nearest 1 cm (low precision).
- The test-tube cannot be filled completely to the brim due to the rounded bottom or rim shape.
Water spilled on transfer / water stuck to sides / measuring cylinder only reads to nearest 1 cm^3
Walkthrough
The internal volume is measured by filling the test-tube with water and pouring it into a measuring cylinder. Sources of error include:
- Transfer loss: Water may spill when pouring from the test-tube to the cylinder.
- Residue: Water may stick to the inside of the test-tube or the sides of the measuring cylinder (adhesion), meaning not all water is transferred or the reading is off.
- Filling: It is hard to tell when the test-tube is exactly full to the brim without overfilling (spilling) or underfilling.
- Instrument precision: The measuring cylinder has 1 cm divisions, so the reading is only accurate to 0.5 or 1 cm.
Key Takeaways
When suggesting errors, think about the physical process: filling, transferring, and reading. Consider losses, residue, and instrument limits.
Common Mistakes
- Saying "human error" or "be more careful" (too vague).
- Suggesting errors for other parts of the experiment (e.g. measuring with a ruler) when asked specifically about .
Things to Be Careful About
The question asks for the internal volume specifically. Focus on the water transfer and reading steps.
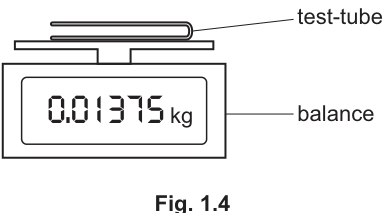
The student uses a balance to measure the mass of the test-tube.
Fig. 1.4 shows the reading on the balance.
Record to the nearest gram.
= ______
Working
The balance reads kg.
Convert to grams: g.
Round to the nearest gram: 14 g.
Answer
14
14 g
Walkthrough
Fig. 1.4 shows a digital balance reading 0.01375 kg. The question asks for the mass to the nearest gram.
- Convert kg to g: g.
- Round to the nearest whole number: 13.75 rounds up to 14 g.
Key Takeaways
Always check the units requested. Digital balances often read in kg; mass in physics problems is often required in g. Rounding rules: 0.5 and above rounds up.
Common Mistakes
- Forgetting to convert kg to g (answering 0.01375).
- Rounding incorrectly (e.g. 13.75 to 13).
- Not following the instruction "to the nearest gram".
Things to Be Careful About
The mark scheme accepts 14. If the candidate uses 13.75 g in the next part, they will get an ECF (error carried forward) mark as long as the calculation is correct.
Use your results from (g)(i) and (e) to calculate the density of the glass from which the test-tube is made using the equation:
Give the unit for your answer.
= ______ unit = ______
Working
Using g and cm:
If using unrounded mass g:
Both are within the acceptable range 2.4 - 2.5 g/cm.
Answer
2.47 (or 2.4 - 2.5)
unit = g/cm
2.47 g/cm^3
Walkthrough
Density is mass divided by volume. The question asks for the unit as well.
Using the rounded mass from (g)(i): g.
Using the volume from (e): cm (or 5.66).
g/cm.
The mark scheme accepts any answer between 2.4 and 2.5 inclusive. If a candidate used 13.75 g (the exact balance reading), they would get g/cm, which is also in range. The mark scheme allows ECF if the candidate's mass or volume is different, as long as the formula and method are correct.
The unit for density is mass/volume. Since mass is in g and volume in cm, the unit is g/cm.
Key Takeaways
Density = mass / volume. Always include the unit. Check if the answer is reasonable (glass density is typically around 2.5 g/cm).
Common Mistakes
- Using the wrong volume (e.g. or instead of ).
- Forgetting the unit or writing it incorrectly (e.g. kg/m without converting, though g/cm is standard here).
- Calculation errors.
Things to Be Careful About
The question explicitly asks for the unit. It must be stated. The mark scheme gives "g/cm". Using kg/m would require converting mass to kg () and volume to m (), giving kg/m. While correct, g/cm is simpler and matches the input units. The mark scheme specifically looks for g/cm.
A student investigates the resistance of a light-emitting diode (LED) when different currents flow through it.
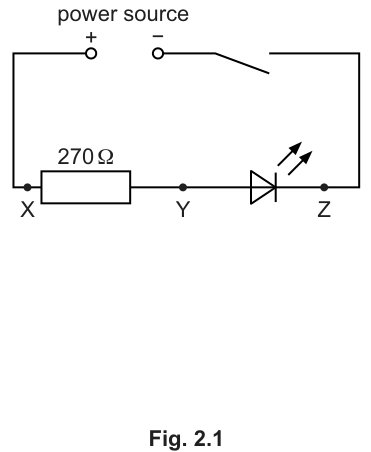
The student sets up the circuit shown in Fig. 2.1.
The student:
- connects a voltmeter across the resistor between points X and Y
- closes the switch
- records the voltmeter reading of the potential difference in the top row of Table 2.1
- opens the switch.
Table 2.1
| resistance between X and Y / | / | / | / | / | / |
|---|---|---|---|---|---|
| 270 | ______ | 2.1 | ______ | ______ | ______ |
| 470 | 2.6 | 2.0 | 4.6 | 0.0053 | 380 |
| 560 | ______ | 2.0 | 4.6 | 0.0046 | 430 |
On Fig. 2.1, draw the symbol for a voltmeter connected to measure the potential difference across the resistor.
Answer
A voltmeter symbol (a circle with a 'V' inside) is drawn connected in parallel across points X and Y, bridging the resistor.
Voltmeter symbol (circle with V) connected in parallel across the 270 Ω resistor between X and Y
Walkthrough
The question asks for the symbol for a voltmeter and its correct placement. A voltmeter is always connected in parallel with the component whose potential difference is being measured. Here, we need to measure , the p.d. across the resistor between points X and Y. We draw the standard circuit symbol for a voltmeter (a circle containing the letter V) and connect it with wires to points X and Y, forming a parallel branch across the resistor.
Key Takeaways
- The circuit symbol for a voltmeter is a circle with a 'V' inside.
- A voltmeter must always be connected in parallel with the component across which the potential difference is to be measured.
Common Mistakes
- Drawing an ammeter symbol (circle with an 'A') instead of a voltmeter.
- Connecting the voltmeter in series with the resistor, which would break the circuit or give an incorrect reading due to the voltmeter's very high resistance.
Things to Be Careful About
- Ensure the voltmeter symbol is clearly a circle, not a square (that would be a resistor).
- The connections to X and Y must be drawn clearly to show a parallel connection, not just touching the wire at one point.
Fig. 2.2 shows the voltmeter reading of the potential difference when the voltmeter is connected across the resistor.
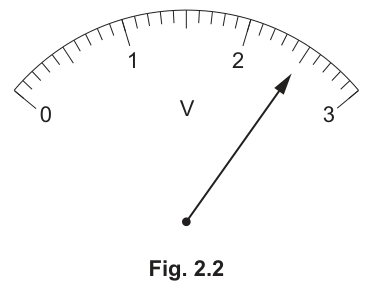
Record in Table 2.1.
Answer
Record 2.5 in the column for the resistor row.
2.5
Walkthrough
Fig. 2.2 shows an analog voltmeter dial with a range from 0 to 3 V. The scale is divided into major units of 1 V, and each 1 V interval is subdivided into 10 small divisions, meaning each small division represents . The pointer is pointing exactly halfway between 2 and 3, at the fifth small division past 2. This gives a reading of .
Key Takeaways
- When reading an analog scale, determine the value of each small division first.
- Record the reading to the precision allowed by the scale, including a trailing zero if necessary (e.g., 2.5, not 2).
Common Mistakes
- Reading the scale incorrectly (e.g., reading 2.05 or 25).
- Failing to include the correct unit (V) if the blank requires it, though here the table header already has the unit.
Things to Be Careful About
- Ensure you are reading the correct scale. The dial shows 0 to 3, so the reading is in volts.
- The pointer is exactly on the mark, so 2.5 is the precise reading to one decimal place.
The student:
- disconnects the voltmeter from points X and Y
- reconnects the voltmeter across the LED between points Y and Z
- closes the switch
- records the voltmeter reading of the potential difference in the correct row of Table 2.1
- opens the switch.
Working
Answer
Record 4.6 in the column.
4.6
Walkthrough
The table requires the sum of the potential differences across the resistor () and the LED () for the first row. From part (a)(ii), . The table gives . Adding these together: . This sum represents the total potential difference supplied by the power source (e.m.f.) in this series circuit.
Key Takeaways
- In a series circuit, the sum of the potential differences across the components equals the total e.m.f. of the source.
- Data processing often involves simple arithmetic on recorded readings.
Common Mistakes
- Adding the wrong columns or misaligning rows.
- Forgetting that the sum should ideally be constant (equal to the battery e.m.f.) across all rows.
Things to Be Careful About
- Ensure the values are taken from the correct row (the resistor row).
The current in the circuit can be calculated using the equation:
where .
Calculate . Record your answer in Table 2.1.
Working
Answer
Record 0.0093 in the column.
0.0093
Walkthrough
The current flowing through the circuit is the same everywhere in series. We can calculate it using the resistance of the known resistor () and the potential difference across it (). Using Ohm's law:
Rounding to two significant figures (consistent with the data), we get . The mark scheme also accepts if a slightly different reading or rounding was used.
Key Takeaways
- Current in a series circuit is the same through all components.
- Ohm's law can be applied to any known resistor to find the circuit current.
Common Mistakes
- Using the wrong voltage (e.g., using or the total voltage 4.6 V with the 270 Ω resistor).
- Calculation errors or incorrect rounding.
Things to Be Careful About
- The resistance is in ohms () and voltage in volts (V), so the current is directly in amperes (A). No unit conversion is needed here.
The resistance of the LED can be calculated using the equation:
Calculate . Record your answer in Table 2.1.
Working
Answer
Record 227 in the column.
227
Walkthrough
The resistance of the LED is found using the potential difference across it () and the current flowing through it (). Using Ohm's law rearranged for resistance:
Rounding to 3 significant figures gives . The mark scheme accepts a range (226-230) due to rounding differences in the current value used.
Key Takeaways
- Ohm's law applies to any component, including non-ohmic devices like LEDs, to find their resistance at a specific operating point.
- LEDs are non-ohmic, meaning their resistance changes with current/voltage.
Common Mistakes
- Using the wrong voltage or current value.
- Failing to round appropriately.
Things to Be Careful About
- Use the unrounded value of () for this calculation to avoid compounding rounding errors. If you use , you get , which is also accepted.
The student repeats the procedure in (a) and (b), replacing the resistor, first with a resistor and then with a resistor.
The student’s results are shown in Table 2.1, but the value of for the resistor is missing.
Calculate and record your answer in Table 2.1 on page 6.
Working
Using for the resistor:
Alternatively, using the constant total voltage:
Answer
Record 2.576 (or 2.6) in the column for the resistor row.
2.576
Walkthrough
We need to find the missing for the row where the resistor is . We are given and .
Method 1: Use Ohm's law on the known resistor.
Method 2: Use the fact that the total voltage is constant (equal to the battery e.m.f., which is from the other rows).
Both methods are valid and accepted by the mark scheme. The slight difference (2.576 vs 2.6) is due to experimental rounding in the recorded current or voltages.
Key Takeaways
- The total voltage in a series circuit is the sum of the voltages across components and remains constant if the source is unchanged.
- Ohm's law can be used to find any missing quantity in a circuit if the others are known.
Common Mistakes
- Using the wrong row's data.
- Calculation errors.
Things to Be Careful About
- The mark scheme accepts either 2.576 or 2.6. If using the subtraction method, 2.6 is the direct answer. If using , 2.576 is exact.
As the resistance between terminals X and Y changes, the current in the circuit changes.
Examine the results in Table 2.1.
Describe how the change in current affects:
Answer
The value of remains constant (at 4.6 V).
remains constant
Walkthrough
Looking at the column in Table 2.1, the values are 4.6, 4.6, and (calculated) 4.6. This sum represents the total potential difference supplied by the power source. As the resistance between X and Y changes, the current changes, but the total voltage supplied by the battery remains the same. Therefore, the sum of the potential differences across the resistor and the LED remains constant.
Key Takeaways
- In a simple series circuit with a constant voltage source, the sum of the p.d.s across the components equals the source e.m.f. and is constant.
- Data analysis involves looking for trends and constants in calculated columns.
Common Mistakes
- Saying it 'increases' or 'decreases' without checking the actual data.
- Confusing with alone (which does change).
Things to Be Careful About
- The question asks specifically about , not about individual voltages.
Answer
As the current decreases, the resistance increases.
(Or: As the current increases, the resistance decreases.)
as the current decreases the resistance increases
Walkthrough
Examine the and columns in Table 2.1:
- Row 1: ,
- Row 2: ,
- Row 3: ,
As the current gets smaller (0.0093 → 0.0053 → 0.0046), the resistance gets larger (227 → 380 → 430). This shows that the LED is a non-ohmic component; its resistance is not constant but depends on the current flowing through it. Specifically, at lower currents, its resistance is higher.
Key Takeaways
- LEDs are non-ohmic devices; their resistance changes with the operating point (current/voltage).
- When analyzing data, look at how one variable changes in relation to another.
Common Mistakes
- Saying 'resistance is constant' (that would be for an ohmic resistor at constant temperature).
- Getting the relationship backwards (saying resistance decreases as current decreases).
Things to Be Careful About
- The question asks to 'describe how the change in current affects '. You must state the direction of the change for both (e.g., 'as current decreases, resistance increases').
Another student assembles a circuit using the circuit diagram shown in Fig. 2.1. This student finds that, when the switch is closed, the LED does not light up.
The student tests the components and finds that the power source is producing an e.m.f., and that none of the other components are broken.
Suggest the error this student has made while assembling the circuit.
Answer
The LED is connected the wrong way around (backwards / in reverse bias).
(Alternatively: The power source / battery is connected the wrong way around.)
diode connected the wrong way around
Walkthrough
An LED (Light Emitting Diode) is a polarized component; it only allows current to flow in one direction (forward bias). If it is connected in reverse (cathode to positive, anode to negative), it acts like an open circuit and will not light up, even if the rest of the circuit is correct and the battery is working. Since the mark scheme states the power source is producing an e.m.f. and no other components are broken, the most likely error is that the LED is inserted backwards. Another possibility is the battery is connected backwards, which has the same effect.
Key Takeaways
- Diodes and LEDs only conduct current in one direction (forward bias).
- Troubleshooting a non-functional circuit involves checking the polarity of polarized components.
Common Mistakes
- Suggesting a blown fuse or broken wire (the scheme says no other components are broken).
- Saying 'the battery is dead' (the scheme says it is producing an e.m.f.).
Things to Be Careful About
- The question asks for 'the error', implying a single specific assembly mistake. 'Diode connected the wrong way around' is the most direct and common answer for an LED not lighting.
Name and draw the symbol of a single device that can be used to change the current in the circuit without the need to connect different resistors across the terminals X and Y in the circuit in Fig. 2.1.
name of device ______
symbol for device
Answer
name of device: variable resistor
symbol for device:
A rectangle with a diagonal arrow passing through it (arrowhead emerging from the rectangle, tail on the opposite side).
variable resistor
Walkthrough
To change the current in the circuit without swapping out the fixed resistors between X and Y, the student can replace the fixed resistor with a variable resistor (also called a rheostat or potentiometer, but 'variable resistor' is the standard O Level term). This allows the resistance to be adjusted continuously, changing the current and thus the voltage across the LED.
The circuit symbol for a variable resistor is a rectangle (representing the resistive element) with a diagonal arrow (representing the slider/brush) passing through it. The arrow must be tilted and its head must emerge from the rectangle. The connections to the rest of the circuit are made to the ends of the rectangle.
Key Takeaways
- A variable resistor is used to control or vary the current in a circuit.
- The circuit symbol is a rectangle with a diagonal arrow through it.
Common Mistakes
- Drawing a fixed resistor symbol (just a rectangle) without the arrow.
- Drawing the arrow vertically or horizontally instead of diagonally.
- Making the rectangle a square (it should be a rectangle, wider than it is tall, though this is sometimes lenient).
- Naming it 'rheostat' (acceptable but 'variable resistor' is preferred in 5054).
Things to Be Careful About
- The symbol must be drawn clearly. The arrow must have an arrowhead. The box must be open on the sides where the circuit wires connect to it. See the marking scheme guidance diagram for exact acceptable variations.
A student investigates the image formed by a converging lens.
The student:
- arranges the apparatus as shown in Fig. 3.1
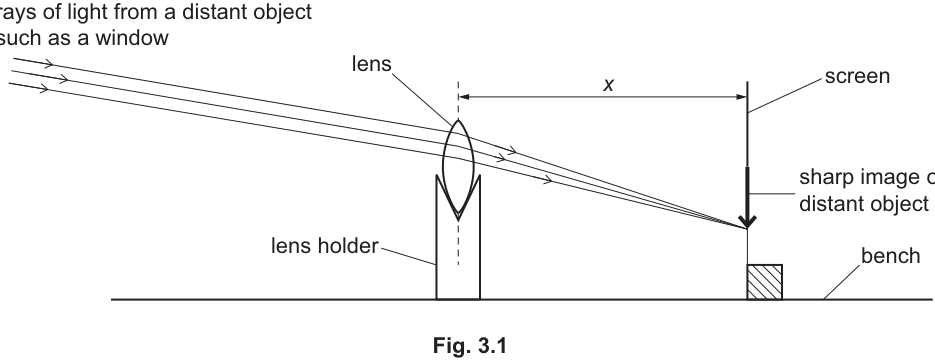
- places a white screen approximately from the lens
- adjusts the position of the screen until a sharp image of a window in the laboratory, a few metres distant from the lens, is formed on the screen.
Measure and record, in centimetres to the nearest , the distance on Fig. 3.1 from the lens to the screen.
= ______
Answer
5.1 cm
Walkthrough
To measure the distance from the centre line of the lens to the screen on Fig. 3.1:
- Align a metric ruler with the line representing .
- Read off the distance between the dashed vertical line of the lens and the vertical line of the screen.
- The measured distance is .
Key Takeaways
- Always measure printed lengths carefully with a transparent or rigid ruler.
- State measurements to the precision requested (nearest ).
The distance shown on Fig. 3.1 is drawn to a scale of one-third full size.
Use your answer from (a)(i) to calculate the actual distance from the lens to the screen.
This distance is the focal length of the lens.
= ______
Working
Answer
15.3 cm
Walkthrough
The diagram is drawn to a scale of one-third full size (). Therefore, to find the actual focal length :
Substitute :
Key Takeaways
- When an image or diagram is scaled to of full size, the actual dimension is found by multiplying the measured length by .
Common Mistakes
- Dividing by 3 instead of multiplying by 3.
The student:
- rearranges the apparatus as shown in Fig. 3.2
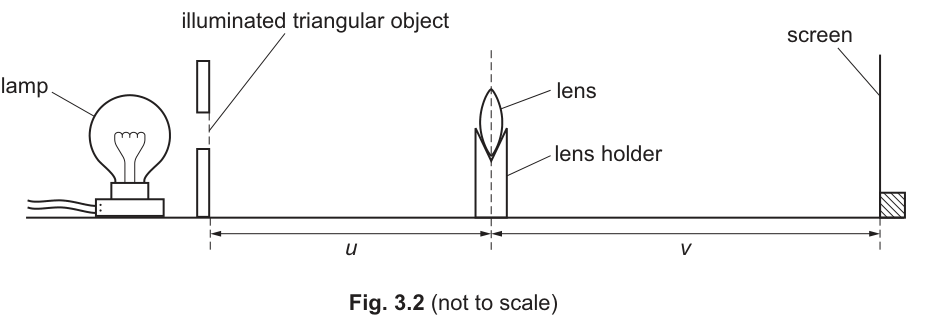
- switches on the lamp
- places the lens a distance from an illuminated triangular object
- adjusts the position of the screen until a sharp image of the triangular object is formed on the screen
- measures the image distance from the lens to the screen.
Calculate the values of and .
Record your values of and to an appropriate number of significant figures on the answer lines and in the first row of Table 3.1.
= ______
= ______
Working
Answer
(or )
(u + v) = 80.5, uv = 1210
Walkthrough
Given values:
- Calculate :
(Allowing 2 or 3 significant figures: or ).
- Calculate :
(Written to 3 significant figures as , matching the style of the data in Table 3.1).
Key Takeaways
- Calculated quantities should maintain consistent significant figures with existing table data.
The student repeats (b) for values of between and .
The student’s results are shown in Table 3.1.
Add appropriate units to the headers of the last two columns.
Table 3.1
| / | / | / ______ | / ______ |
|---|---|---|---|
| 20.0 | 60.5 | ||
| 25.0 | 37.3 | 62 | 933 |
| 40.0 | 24.7 | 65 | 988 |
| 50.0 | 21.7 | 72 | 1090 |
| 55.0 | 20.7 | 76 | 1140 |
Answer
Unit for :
Unit for :
cm and cm^2
Walkthrough
- is the sum of two lengths, each in , so its unit is .
- is the product of two lengths (), so its unit is .
Key Takeaways
- Adding quantities preserves their unit ().
- Multiplying two lengths results in an area unit ().
Common Mistakes
- Writing instead of for the product .
On the grid provided in Fig. 3.3, plot a graph of on the y-axis against on the x-axis.
You do not need to start either axis from the origin . Draw the straight line of best fit.
Answer
-
Axes:
- y-axis labelled:
- x-axis labelled:
-
Scales:
- x-axis: e.g., starting at , with per major division up to
- y-axis: e.g., starting at , with per major division up to
- Both scales are linear and occupy more than half the grid.
-
Points plotted:
- All points accurately plotted to within half a small square.
-
Line of best fit:
- A single, continuous, thin straight line passing evenly through the points.
Graph plotted with correctly labelled axes, appropriate scales, accurate points, and a straight line of best fit
Walkthrough
-
Axes and Labels:
- Vertical axis (y-axis):
- Horizontal axis (x-axis):
-
Choosing Scales:
- The values range from to . A suitable range is to or .
- The values range from to . A suitable range is to .
- Do not use awkward scale steps (such as 3, 7, 9 units per division). Standard scales use increments of 1, 2, or 5 .
-
Plotting Points:
- Plot all 5 data pairs using small neat crosses () or encircled dots ().
- Ensure each point is plotted within half a small square of its true position.
-
Best-Fit Line:
- Use a long ruler to draw a single thin straight line that balances the points on either side with an even distribution.
Key Takeaways
- Always label axes with both the quantity and its unit.
- Scales must be linear and use at least half the grid in both directions.
- Draw a thin, continuous best-fit line without kinks or double lines.
Common Mistakes
- Swapping the axes (plotting on the y-axis instead of ).
- Forcing the line through the origin when it does not pass through it.
- Using an awkward non-standard scale.
Calculate the gradient of the line.
Indicate on the graph the points you use.
Show all your working.
gradient = ______
Working
Using coordinates read from the line of best fit with a triangle occupying of the drawn line:
Answer
(values in the range to are accepted)
15.0
Walkthrough
- Select two points on the line of best fit that are far apart (the distance between them must be at least half the length of the drawn line). Do not use table data points unless they lie exactly on the line.
- Mark the coordinates clearly or draw a gradient triangle on the graph.
- Compute the gradient:
- With points and :
Key Takeaways
- The gradient triangle must span at least half the length of the line of best fit.
- Always read coordinates from the line itself, not raw data points from the table.
Common Mistakes
- Inverting the gradient fraction (calculating ).
- Using a triangle that is too small (less than half the length of the line).
- Dividing a single coordinate pair ().
Two quantities can be considered to be the same within the limits of experimental accuracy if their values are within 10% of each other.
The gradient of your line calculated in (e) is numerically equal to the focal length of the lens in .
Compare your value of obtained in (a)(ii) with the value of the gradient obtained in (e).
State if your two values can be considered to be the same.
Support your statement with a calculation.
calculation
statement ______
Working
Calculation of percentage difference:
Since , the two values are within experimental accuracy.
Answer
statement: Yes, the two values can be considered the same because they are within of each other (difference is ).
statement: Yes, the values are the same within experimental limits (percentage difference is 2.0%, which is less than 10%)
Walkthrough
-
We compare the two values of focal length:
- Value from (a)(ii):
- Value from (e) (gradient):
-
Compute the difference:
- Compute the percentage difference:
(or relative to : ).
- Since is less than , state that the two values are the same within the limits of experimental accuracy.
Key Takeaways
- To support a comparison statement, calculate the percentage difference and compare it explicitly to the given tolerance ().
Common Mistakes
- Making a statement without showing the calculation.
- Subtracting without finding the percentage difference.
When measuring the object and image distances with a metre rule, it is important to avoid line-of-sight (parallax) errors.
State how the student avoids parallax errors when doing the experiment.
Answer
View the scale reading at right angles (perpendicularly / directly from above / at eye level).
View the scale reading at right angles to the rule
Walkthrough
Parallax error occurs when an observer views a scale from an angle, causing the pointer or mark to appear displaced relative to the scale markings.
To avoid parallax error when reading a metre rule:
- Ensure the line of sight is perpendicular (at right angles / ) to the scale at the point of measurement.
- View the scale at eye level or directly from above.
Key Takeaways
- Avoiding parallax requires perpendicular viewing to the scale.
Describe a technique that the student uses to make sure that the image on the screen is as sharply focused as possible.
Answer
Move the screen slowly backwards and forwards until the sharpest image is seen.
Move the screen slowly backwards and forwards until the image is as sharp as possible
Walkthrough
To find the exact position of best focus for a real image formed on a screen:
- The candidate moves the screen slowly back and forth across the approximate image location.
- By observing when the edges of the image become clear and sharp before beginning to blur again in either direction, the exact position of maximum sharpness can be determined.
Key Takeaways
- Fine adjustments by moving backwards and forwards allow precise identification of the point of sharp focus.
Common Mistakes
- Giving vague answers such as "look closely" or "use a better lens".
Water is heated from room temperature to its boiling temperature in a glass beaker.
Plan an experiment to investigate if the time taken for the water to reach its boiling temperature depends on the diameter of the water surface exposed to the air.
You are provided with:
- a supply of cold water
- a set of glass beakers of different sizes
- a Bunsen burner, tripod and gauze
- a measuring cylinder.
You may use any other common laboratory apparatus.
In your plan include:
- any other apparatus needed
- a brief description of the method, including what you will measure and how you will make sure your measurements are accurate
- the variables you will control
- a results table to record your measurements (you are not required to enter any readings in the table)
- how you will process your results to draw a conclusion.
You may include a labelled diagram if you wish.
Answer
Additional apparatus: stopwatch (or timer) and a ruler / measuring tape.
Method:
- Use the ruler / measuring tape to measure and record the diameter of each beaker.
- Use the measuring cylinder to measure a fixed volume of cold water (e.g. 200 cm³) and pour it into the beaker.
- Place the beaker on the tripod and gauze over the Bunsen burner, with the flame set to a constant, steady size.
- Light the Bunsen and start the stopwatch. Stop the stopwatch as soon as the water reaches boiling temperature (starts to boil).
- Record the time in the results table.
- Repeat the experiment for each beaker of different diameter, and repeat each measurement to improve accuracy (take an average).
Variables to control: the volume (or mass) of water, the initial temperature of the cold water, and the size of the Bunsen flame.
Results table:
| Diameter of beaker / cm | Time to boil / s |
|---|---|
Processing and conclusion: Plot a graph of time to boil against diameter . If the points lie on a line or curve, the diameter affects the time taken; if the graph is horizontal (time constant), the diameter has no effect. Alternatively, compare the times in the table to see if / how the diameter affects the time taken to boil.
Full plan: stopwatch and ruler as additional apparatus; method measures diameter and time to boil for each beaker; controls water volume, initial temperature and flame; results table with d and t columns; graph of time against diameter for the conclusion.
Walkthrough
This is a planning question: you are not asked to do the experiment, only to say how you would do it. The examiners award six separate marks, so your plan must cover six things: the extra apparatus, measuring the diameter, timing the boiling for each beaker, controlling the other variables, a results table with units, and how to process the results.
Step 1 — additional apparatus. The given list has beakers, a Bunsen burner, tripod and gauze, and a measuring cylinder, but nothing to measure time or the diameter. You need a stopwatch to time the boiling and a ruler or measuring tape to measure the diameter of each beaker.
Step 2 — method. The independent variable is the diameter of the water surface (the beaker diameter). You measure each beaker's diameter with the ruler. The dependent variable is the time taken to reach boiling. You heat a fixed amount of water and time how long it takes to boil, repeating for each beaker. To make the measurements accurate, keep the flame constant, use the same volume of water at the same initial temperature, and repeat each timing and take an average.
Step 3 — control variables. Anything that could change the boiling time other than the diameter must be kept the same: the volume of water, its initial (cold) temperature, and the Bunsen flame size.
Step 4 — results table. A table needs a column for each variable with the quantity and its unit in the heading: diameter in cm, time in s. No readings are required.
Step 5 — processing. Plot a graph of time against diameter, or simply compare the times. If the time changes with diameter, the diameter matters; if the time is the same for all diameters, it does not.
Key Takeaways
- A plan must cover all the marking points: apparatus, method, control variables, table and processing.
- The independent variable is the one you change (diameter); the dependent variable is the one you measure (time); everything else is controlled.
- A results table always has the quantity and unit in the column heading.
- To draw a conclusion, either plot a graph or compare the measurements.
Common Mistakes
- Forgetting the stopwatch and ruler — without them you cannot time the boiling or measure the diameter.
- Not controlling variables: different volumes of water or different flame sizes would make the comparison invalid.
- Table columns without units.
- Giving a conclusion that does not use the data.
Things to Be Careful About
- The mark scheme credits 'any one' control variable, but a good plan lists several.
- The mark scheme accepts either a graph or a table comparison for the conclusion — you only need one.
- Plot time against diameter (time on the y-axis, diameter on the x-axis).
- Repeats and averaging improve accuracy.