Physics 5054/41 — October/November 2024
Cambridge O-Level · Alternative to Practical · worked solutions for every part, with the mark scheme
Topics Experimental Contexts · Observations and Measurements · Use of Techniques, Apparatus and Materials · Analysis, Conclusions and Evaluation · Planning Experiments and Investigations
A student measures the volume of two identical straws by different methods.
method 1
The student takes one straw and:
- cuts it into 5 pieces that are equal in length
- lines up the pieces of straw as shown in Fig. 1.1
- ensures the pieces of straw are touching.
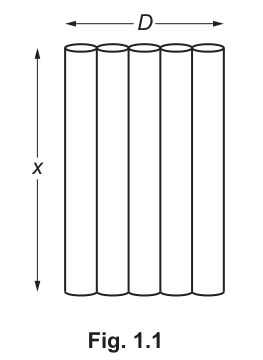
Fig. 1.1 is drawn actual size.
Measure and record lengths and to the nearest 0.1 cm.
= ______
= ______
Answer
x = 4.3 cm, D = 2.8 cm
Walkthrough
The question states that Fig. 1.1 is drawn actual size. We must use a ruler to measure the lengths and directly from the printed figure. The vertical arrow indicates the length of one piece of straw. Reading from the figure, . The horizontal arrow indicates the total width across all 5 touching straw pieces. Reading from the figure, . The question asks for readings to the nearest 0.1 cm, so we record them as 4.3 and 2.8.
Key Takeaways
When a diagram is stated to be drawn actual size, you can measure lengths directly with a ruler. Always record measurements to the precision demanded by the question, including a trailing zero if necessary (e.g., 4.3, not 4).
Common Mistakes
- Forgetting to include the unit (cm).
- Reading to the wrong precision (e.g., 4 cm instead of 4.3 cm).
- Measuring from the wrong points on the arrows.
Things to Be Careful About
Ensure your ruler is placed exactly along the arrows. The marking scheme accepts values close to 4.3 and 2.8, but since this is a digital representation, we use the exact values provided in the scheme: 4.3 cm and 2.8 cm. Note that is the total width of 5 straws, not just one.
Use your value of in (a)(i) to calculate the length of the straw before it was cut into pieces.
= ______
Working
The straw was cut into 5 equal pieces.
Answer
21.5 cm
Walkthrough
The original straw was cut into 5 equal pieces. The length of one piece is . To find the total length of the straw before cutting, we multiply the length of one piece by the number of pieces.
Key Takeaways
When an object is cut into equal pieces, the original length is the piece length multiplied by the number of pieces.
Common Mistakes
- Using the wrong number of pieces (e.g., multiplying by 4 instead of 5).
- Forgetting the unit.
Things to Be Careful About
Use the value of from part (a)(i). If you used a different value for , you would carry that forward (ecf), but here we use the scheme value 4.3 cm.
Use your value for in (a)(i) to calculate the diameter of one straw. Give your answer to the nearest 0.01 cm.
= ______
Working
The width is across 5 touching straws, so the diameter of one straw is divided by 5.
Answer
0.56 cm
Walkthrough
The total width covers 5 identical straws lined up side by side. To find the diameter of a single straw, divide by 5.
The question asks for the answer to the nearest 0.01 cm, which is exactly 0.56 cm.
Key Takeaways
When identical objects are lined up, the total dimension is the single dimension multiplied by the number of objects. Divide to find the single dimension.
Common Mistakes
- Dividing by the wrong number.
- Not giving the answer to the required precision (0.01 cm).
Things to Be Careful About
The diameter is 0.56 cm, which is already to 2 decimal places. Ensure you don't round it incorrectly.
Explain how the student uses a ruler and two set squares to make sure that the measurement of is as accurate as possible.
You may draw a diagram to help your explanation.
Answer
Place a ruler on the table. Place a set square at each end of the row of straws, with one edge against the ruler and the other edge touching the end of the straw. Ensure the set squares are parallel and lined up with the ruler's scale. Read the distance between the set squares.
Use set squares at each end lined up with the ruler to ensure accurate measurement of the width D.
Walkthrough
Measuring the diameter of a cylindrical straw directly with a ruler is inaccurate because the curved surface makes it hard to align the ruler's zero mark or read the edge precisely. To measure the total width accurately, the student should:
- Place a ruler on a flat surface.
- Place a set square (right-angled triangle) at one end of the row of straws, with one flat edge against the ruler and the perpendicular edge touching the side of the first straw.
- Place a second set square at the other end, similarly aligned with the ruler and touching the last straw.
- The set squares ensure the measurement is taken perpendicular to the length of the straws, giving an accurate width .
Key Takeaways
Set squares are used to project parallel lines from the ends of an object onto a ruler, allowing accurate measurement of width or diameter.
Common Mistakes
- Saying "use a set square to measure" without explaining how (lining up with the ruler).
- Not mentioning that set squares are used at both ends.
Things to Be Careful About
The mark scheme specifically credits "use of set squares at each end lined up with rule". Ensure you mention both set squares and the ruler.
The volume of the straw is given by the equation:
Use your answers from (a)(ii) and (a)(iii) to calculate . Give your answer to two significant figures.
= ______
Working
Given:
Substitute and :
Rounding to 2 significant figures:
Answer
5.3 cm^3
Walkthrough
The volume of a cylinder is given by . The formula uses 3.14 for .
Substitute the values calculated in previous parts:
, .
Calculate the numerator: . Then . Divide by 4: .
The question asks for the answer to 2 significant figures. rounded to 2 s.f. is .
Key Takeaways
Always show the substitution into the formula before calculating the final answer. Pay attention to the required number of significant figures.
Common Mistakes
- Using the radius instead of the diameter (or forgetting to square the diameter and divide by 4).
- Rounding to the wrong number of significant figures (e.g., 5.29 instead of 5.3).
- Forgetting the unit .
Things to Be Careful About
The formula uses , not . If you used , you would calculate , which is the same result. Ensure you use the values from (a)(ii) and (a)(iii) exactly as calculated.
method 2
The student:
- takes the second straw
- immerses the straw fully in a container of water as shown in Fig. 1.2
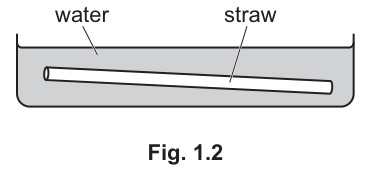
- moves the straw backwards and forwards in the water several times so that the water enters the straw
- puts a finger firmly over one end of the straw, and removes the straw from the water
- puts the straw above the open end of a 50 measuring cylinder, and then removes the finger so that the water is transferred into the measuring cylinder.
The student repeats the process 4 more times for a total of 5 transfers.
Fig. 1.3 shows the total volume of water in the measuring cylinder.
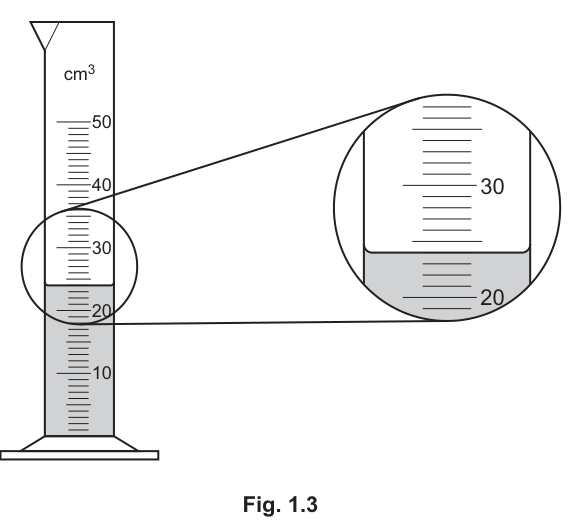
Write down the reading .
= ______
Answer
24 cm^3
Walkthrough
Fig. 1.3 shows a 50 cm³ measuring cylinder. The inset magnifies the liquid level. The scale has major markings at 20 and 30 cm³, with 10 divisions between them, so each division represents 1 cm³. The liquid forms a meniscus (curved surface). For water, the meniscus is concave, and we read the volume at the bottom of the meniscus. In the magnified view, the bottom of the meniscus aligns with the 4th line above 20, which is 24 cm³.
Key Takeaways
Always read the bottom of the meniscus for water. Ensure the scale divisions are correctly interpreted.
Common Mistakes
- Reading the top of the meniscus.
- Miscounting the divisions (e.g., reading 23 instead of 24).
- Not including the unit.
Things to Be Careful About
The mark scheme gives 24 cm³ as the correct answer. Ensure you read to the precision of the instrument (1 cm³ divisions, so no decimal places needed unless interpolating, but here it aligns with a mark).
Working
The total volume was transferred 5 times.
The average volume in one straw is:
Answer
4.8 cm^3
Walkthrough
The student transferred water from the straw into the measuring cylinder 5 times (the initial transfer plus 4 more). The total volume collected is . To find the average volume of water in one straw, divide the total volume by the number of transfers.
Key Takeaways
When a process is repeated multiple times to collect a total quantity, divide the total by the number of repetitions to find the quantity per repetition.
Common Mistakes
- Dividing by 4 instead of 5 (forgetting the initial transfer).
- Forgetting the unit.
Things to Be Careful About
The question states "repeats the process 4 more times for a total of 5 transfers". Ensure you use 5 as the divisor.
Answer
- The internal volume of the straw is smaller than the external volume calculated in method 1 (method 1 measures outer dimensions, method 2 measures internal capacity).
- Air bubbles may remain in the straw during method 2, reducing the volume of water collected.
(Other acceptable reasons: straw became squashed/damaged during cutting; small amount of water remains in straw after transfer; water sticks to the finger; some water falls out during transfer; straw not completely filled with water.)
Internal volume is smaller than external volume; air bubbles in straw; water remains in straw; water sticks to finger; straw damaged.
Walkthrough
Method 1 calculates the volume based on external dimensions (diameter and length), assuming the straw is a solid cylinder or measuring the outer volume. Method 2 measures the actual internal capacity by filling it with water and transferring it. The difference arises because:
- Internal vs. External Volume: Method 1 uses the outer diameter , which includes the thickness of the straw walls. The actual volume of water the straw can hold (internal volume) is less than the outer volume calculated.
- Incomplete Filling/Transfer Losses: In method 2, it is difficult to ensure the straw is completely filled with water. Air bubbles may get trapped. When transferring, some water may stick to the finger, remain in the straw, or spill out. These losses mean is likely less than the true internal volume, and both and differ due to these practical limitations.
Key Takeaways
When comparing two methods of measurement, consider what each method actually measures (outer vs. inner dimensions) and practical errors (losses, bubbles, damage).
Common Mistakes
- Saying "human error" or "be more careful" (too vague).
- Only giving one reason when two are required.
- Not understanding that method 1 measures outer volume while method 2 measures inner capacity.
Things to Be Careful About
The question asks for two reasons. Any two from the list of valid practical errors or the geometric difference (internal vs external) will score. Be specific about the physics or practical aspect.
A student investigates series and parallel combinations of resistors.
The student is provided with two resistors, X and Y, connected in the circuit shown in Fig. 2.1. The resistors are not identical.
The electromotive force (e.m.f.) of the power supply is 3.0 V.
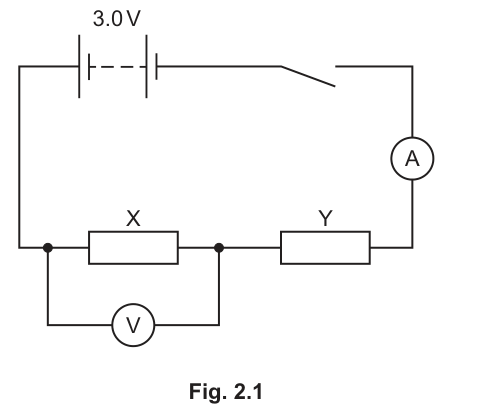
- The student closes the switch.
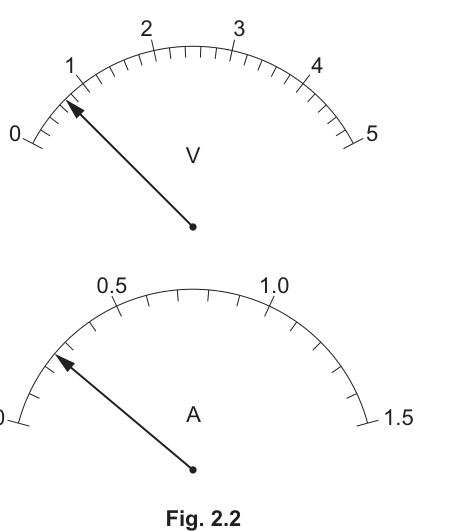
Fig. 2.2 shows the readings on the voltmeter and on the ammeter.
Record the readings of and .
= ______
= ______
- The student opens the switch.
Answer
V_X = 0.7 V, I_S = 0.25 A
Walkthrough
The voltmeter has a 0 to 5 V range. Between 0 and 1 there are 10 small divisions, so each small division represents 0.1 V. The pointer is exactly on the 7th small division past 0, giving a reading of 0.7 V.
The ammeter has a 0 to 1.5 A range. Between 0 and 0.5 there are 10 small divisions, so each small division represents 0.05 A. The pointer is exactly on the 5th small division past 0, giving a reading of 0.25 A.
Key Takeaways
Analogue meters must be read to the precision of the smallest division. Always count the number of divisions between major markings to determine the value of each small division.
Common Mistakes
Reading the scale incorrectly by miscounting the divisions between major markings. Forgetting to include the unit (V or A) in the final answer.
Things to Be Careful About
Ensure you are reading the correct scale for the correct meter. The voltmeter is the top scale (0-5 V) and the ammeter is the bottom scale (0-1.5 A). Read to the precision of the instrument; do not estimate between divisions unless half a division is clearly indicated, which is not the case here.
The resistance of a resistor can be found using the equation:
Calculate , the resistance of resistor X.
= ______
Working
Answer
2.8
Walkthrough
The resistance of resistor X is found by dividing the potential difference across it by the current flowing through it. Using the values recorded in part (a)(i): and . Substituting these into the equation gives .
Key Takeaways
Resistance is the ratio of voltage to current. Always include the correct unit () when stating a resistance value.
Common Mistakes
Forgetting to include the unit in the final answer. Using incorrect values from the meter readings.
Things to Be Careful About
Ensure the voltage and current used are for the same component (resistor X in this case). The ammeter measures the total series current, which is the same as the current through X.
Suggest why the switch is opened after the readings of potential difference and current are recorded.
Answer
To prevent the overheating of the resistors / to prevent the cell from running down.
To prevent overheating of resistors or the cell running down
Walkthrough
Leaving a switch closed in a circuit with low resistance draws a continuous current. This causes the resistors to heat up over time, which can damage them or change their resistance. It also drains the power supply (cell) unnecessarily. Opening the switch between readings prevents these issues.
Key Takeaways
In practical electricity experiments, switches should be opened when not taking readings to prevent component damage and preserve the power supply.
Common Mistakes
Saying 'to save electricity' without specifying what is being saved or why. Saying 'to prevent electric shock' is not appropriate for a 3.0 V low-voltage circuit.
Things to Be Careful About
The mark scheme accepts 'overheating of resistors' or 'cell running down'. Ensure the answer is specific to the practical setup.
- The student disconnects the voltmeter and reconnects it across resistor Y.
The potential difference across Y is given by the equation:
Using this equation and your value of from (a)(i), calculate .
Calculate the resistance of Y.
= ______
= ______
Working
Answer
V_Y = 2.3 V, R_Y = 9.2
Walkthrough
In a series circuit, the total e.m.f. is shared between the components. The power supply is 3.0 V and the voltage across X is 0.7 V, so the voltage across Y is .
The current in a series circuit is the same everywhere, so the current through Y is also . Using Ohm's law, the resistance of Y is .
Key Takeaways
In a series circuit, voltages add up to the total e.m.f. The current is constant throughout. Resistance can be calculated for any component using its own voltage and the shared current.
Common Mistakes
Using the wrong current value. Forgetting that the current is the same through both resistors in series. Arithmetic errors in the subtraction or division.
Things to Be Careful About
Ensure units are consistent. The current is in Amperes and voltage in Volts, giving resistance in Ohms ().
- The student now connects X and Y in parallel.
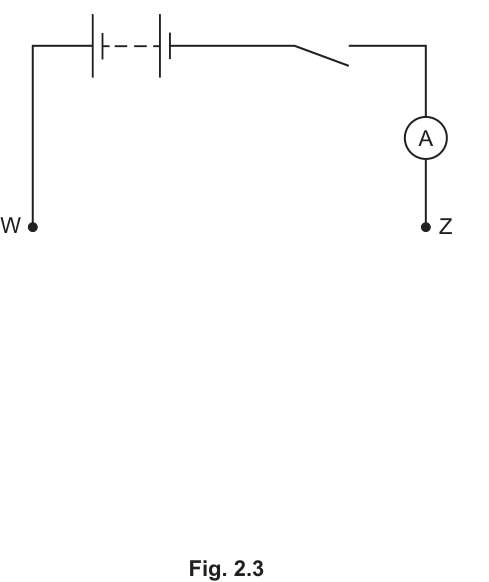
Complete the circuit diagram in Fig. 2.3 to show the two resistors connected in parallel between points W and Z.
Draw the voltmeter connected to measure the potential difference across both resistors.
Answer
Circuit diagram with X and Y in parallel between W and Z, voltmeter across the parallel combination
Walkthrough
To connect X and Y in parallel between W and Z, draw two separate branches between these points. One branch contains resistor X (labelled 'X'), and the other branch contains resistor Y (labelled 'Y'). Both branches must connect to W at one end and Z at the other.
The voltmeter must be connected in parallel to measure the potential difference across the combination. Draw the voltmeter with its terminals connected to the same points as the parallel branches (effectively across W and Z, or across either resistor X or Y, as the voltage is the same across all parallel branches).
Key Takeaways
In a parallel circuit, components are connected in separate branches between the same two nodes. A voltmeter is always connected in parallel with the component or combination whose voltage is being measured.
Common Mistakes
Drawing the resistors in series instead of parallel. Connecting the voltmeter in series with the circuit (which would block current flow). Forgetting to label the resistors X and Y.
Things to Be Careful About
Use standard circuit symbols: rectangular boxes for resistors, a circle with a 'V' for the voltmeter. Ensure all connections are solid lines (wires) and there are no accidental crossings that imply connections without dots. The voltmeter must have high resistance, so it is placed in parallel.
Theory suggests that, if the two resistors are arranged in parallel, the combined resistance is given by:
Use the equation and your values of and from (a)(ii) and (a)(iv) to calculate .
= ______
Working
Answer
(accept 2.2)
2.1
Walkthrough
The formula for the total resistance of two resistors in parallel is . Substituting the values from parts (a)(ii) and (a)(iv): and .
Numerator: .
Denominator: .
.
Rounding to 2 significant figures gives (or if carried further, but is standard). The mark scheme accepts any value rounding to 2.1 or 2.2.
Key Takeaways
The total resistance of a parallel combination is always less than the smallest individual resistance. Here, is less than , which is consistent with theory.
Common Mistakes
Adding the resistances directly () instead of using the parallel formula. Arithmetic errors in multiplying or dividing.
Things to Be Careful About
Ensure you use the correct formula for parallel resistors. Do not confuse it with the series formula (). Keep intermediate values to at least 3 significant figures to avoid rounding errors.
The manufacturer suggests that the combined resistance of resistors X and Y when placed in parallel is 2.5 .
Two quantities can be considered to be equal within the limits of experimental accuracy if their values are within 10% of each other.
State whether your value of calculated in (b)(ii) has the same value as that suggested by the manufacturer. Support your statement with a calculation.
calculation
statement ______
Working
10% of .
Acceptable range: to .
Calculated .
is not within the range .
Answer
calculation: $10% \text{ of } 2.5 = 0.25; \text{ range is } 2.25 \text{ to } 2.75 \ \Omega; \ 2.1 \ \Omega \text{ is outside this range}
statement: No
No, 2.1 is not within 10% of 2.5 (range 2.25-2.75)
Walkthrough
The manufacturer's value is . The question states that values are considered equal if they are within 10% of each other.
Calculate 10% of : .
The acceptable range is to .
The calculated value from part (b)(ii) is .
Since , it falls outside the acceptable range.
Therefore, the calculated value does not have the same value as the manufacturer's suggestion within the limits of experimental accuracy.
Key Takeaways
When comparing experimental values to theoretical or manufacturer values, use the given tolerance percentage to define an acceptable range. If the experimental value falls outside this range, the values are not considered equal within experimental accuracy.
Common Mistakes
Calculating the percentage difference incorrectly (e.g., instead of comparing to the manufacturer's value). Forgetting to state a clear 'Yes' or 'No' conclusion. Not showing the calculation to support the statement.
Things to Be Careful About
The mark scheme requires both the calculation (showing the 10% range or percentage difference) and the statement ('No'). Ensure the calculation uses the manufacturer's value (2.5) as the basis for the 10% tolerance. is less than , which is greater than the tolerance.
A student does an experiment to find the mass of a metre rule.
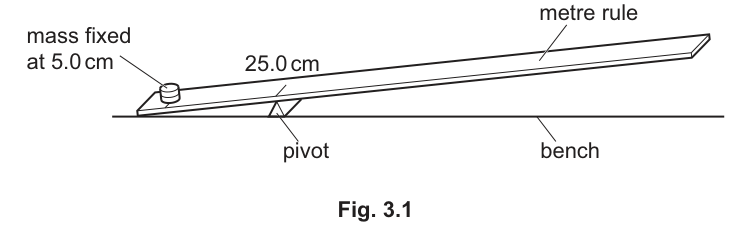
A fixed mass is placed on the metre rule at the 5.0 cm mark as shown in Fig. 3.1.
The student:
- places the pivot below the 25.0 cm mark on the metre rule
- places a mass of mass on the metre rule
- adjusts the position of the 20 g mass until the rule is as close to balance as possible.
The position of the 20 g mass when the rule is as close to balance as possible is shown in Fig. 3.2.
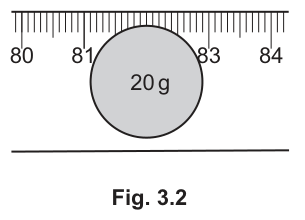
Using Fig. 3.2, determine the distance of the centre of the 20 g mass from the pivot when the metre rule is as close to balance as possible.
= ______
Working
Scale reading at centre of mass
Pivot position
Answer
57 cm
Walkthrough
- Look at Fig. 3.2 to determine the position of the centre of the mass on the metre rule. The centre of the circular mass aligns with the mark on the scale.
- The distance is defined as the distance of the centre of the mass from the pivot.
- The pivot is placed at the mark (from Fig. 3.1 stem).
- Calculate :
Key Takeaways
- Always measure distance from the defined reference point (the pivot at ), not just the scale reading on the ruler.
Common Mistakes
- Writing as the distance instead of subtracting the pivot position ().
Things to Be Careful About
- Ensure the reading is taken from the centre of the mass, not the left or right edges.
Answer
Move the mass slowly backwards and forwards along the metre rule until the rule balances horizontally.
Move the 20 g mass slowly backwards and forwards along the rule until balance is achieved
Walkthrough
To find the balance point accurately, the candidate should describe the technique of moving the movable mass small distances back and forth (or slowly sliding it along the rule) until the rule rests horizontally without tipping to either side.
Key Takeaways
- Balancing an object on a pivot requires fine adjustments around the equilibrium position.
Common Mistakes
- Giving vague descriptions like "put it in the middle" without describing the fine adjustment process.
Things to Be Careful About
- Mentioning that the movement is slow or back-and-forth until horizontal equilibrium is reached.
- The student repeats the procedure for values of mass , 40 g, 50 g and 60 g.
Table 3.1 shows the results.
Add your value of for mass in (a)(i) to Table 3.1.
Calculate for each mass , and record all values in Table 3.1.
Give your answers to an appropriate number of significant figures.
Table 3.1
| 20 | ||
| 30 | 37 | |
| 40 | 28 | |
| 50 | 22 | |
| 60 | 18 |
Working
- For , :
- For , :
- For , :
- For , :
- For , :
Answer
| 20 | 57 | 0.018 |
| 30 | 37 | 0.027 |
| 40 | 28 | 0.036 |
| 50 | 22 | 0.045 |
| 60 | 18 | 0.056 |
1/d values: 0.018, 0.027, 0.036, 0.045, 0.056 (or 2 to 3 s.f.)
Walkthrough
- Insert the value into the table for .
- For each row, calculate :
- (to 2 s.f., or to 3 s.f., )
- (to 2 s.f., or to 3 s.f., )
- (to 2 s.f., or to 3 s.f., )
- (to 2 s.f., or )
- (to 2 s.f., or )
- Check that all values are recorded consistently to 2 or 3 significant figures.
Key Takeaways
- Always maintain consistency in significant figures (usually matching the 2 or 3 s.f. of the raw data).
Common Mistakes
- Rounding to 1 significant figure (e.g., ).
- Writing fractions instead of decimals.
Things to Be Careful About
- Do not mix significant figures arbitrarily; keeping 2 or 3 significant figures across all rows is required by the mark scheme.
Answer
The required distance would be greater than , which means the mass would have to be placed beyond the end of the metre rule.
d would be greater than 75 cm / off the end of the rule
Walkthrough
From the pattern in the table or the principle of moments, as the mass decreases, the required distance to balance the anticlockwise moment increases.
For , . For , would need to be roughly double (well over ). Since the pivot is at , the maximum distance available on the right-hand side of the rule is . Therefore, the mass cannot be placed far enough along the rule to balance it.
Key Takeaways
- Every experimental set-up has geometric/physical boundaries (here, the finite length of the metre rule).
Common Mistakes
- Stating vaguely that " is too light" without explaining that the ruler is not long enough to achieve balance.
Things to Be Careful About
- Explicitly mentioning that the mass would be off the end of the rule or that .
Using the grid provided in Fig. 3.3 on page 13, plot a graph of on the y-axis against on the x-axis.
Start your axes from the origin (0, 0).
Draw the straight line of best fit.
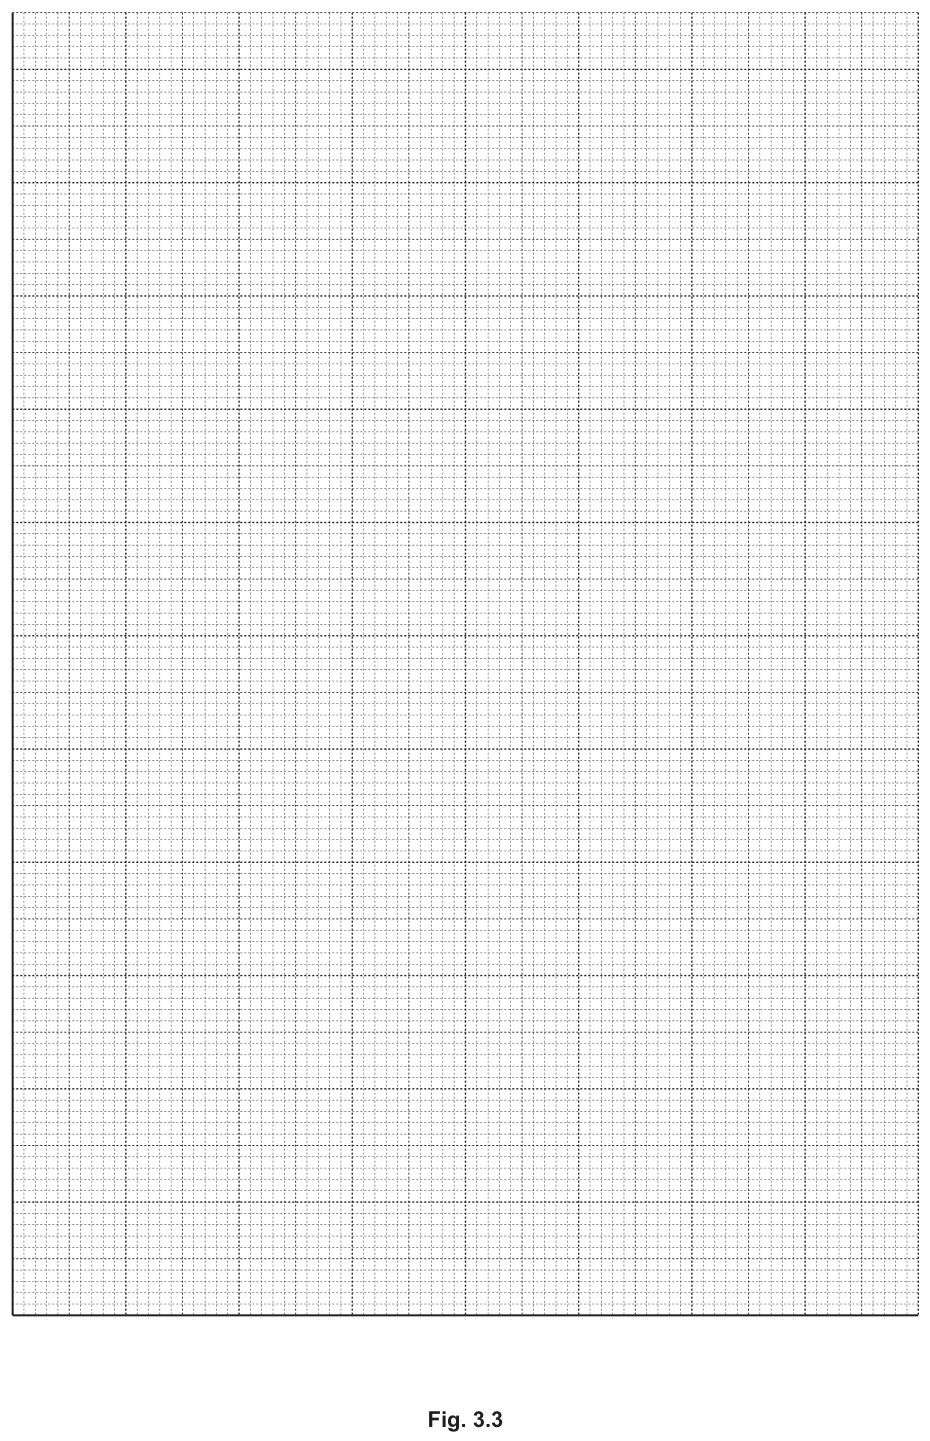
Answer
Plot the graph following these requirements:
- Axes: Horizontal axis labelled and vertical axis labelled (or ).
- Scales: Both axes start from . Linear scales occupying more than half the grid in both directions (e.g. x-axis: per or ; y-axis: per or ).
- Plotting: Points plotted accurately to within small square:
- Best-fit line: Draw a single, thin, straight line of best fit passing through the plotted points.
Graph plotted with correctly labelled axes from (0,0), accurate points, and a straight line of best fit
Walkthrough
- Axes & Labels: Label the y-axis with '' or '' and the x-axis with ''.
- Scale Selection: Both axes must start at . Choose a sensible, non-awkward scale:
- x-axis: to , where each large grid division () represents .
- y-axis: to (or ), where each large division () represents .
- Plot Points: Plot each of the five points from Table 3.1 carefully using neat crosses (x) or circled dots (), ensuring accuracy to within half a small square.
- Line of Best Fit: Using a clear ruler, draw a single straight line that best balances the points on either side with an even distribution.
Key Takeaways
- Graph scales must be easy to read (multiples of 1, 2, 5, or 10) and must span more than half the available grid.
- Best-fit lines should be thin, straight, continuous, and not 'dot-to-dot'.
Common Mistakes
- Omitting units on axis labels.
- Choosing awkward scales like multiples of 3 or 7.
- Forgetting to start axes from as requested.
Things to Be Careful About
- Ensure the line is drawn cleanly with a single stroke of a sharp pencil.
Calculate the gradient of your line.
Show all your working, and indicate on the graph the values you use.
= ______
Working
Select two points on the line of best fit separated by more than half the line (e.g. and ):
Answer
(or )
9.6 x 10^-4 (allow 0.00086 to 0.00106)
Walkthrough
- Indicate coordinates on the line: Choose two points on the drawn straight line (not necessarily data points) that are far apart, spanning at least half the length of the line (i.e. ). Indicate these points clearly with a triangle or markings on the graph.
- Calculate and :
- Compute gradient : For example, .
- The acceptable range according to the mark scheme is (i.e. to ).
Key Takeaways
- Always use a large triangle () to minimize reading uncertainty.
- Gradient read-offs must come from the best-fit line, not raw table values.
Common Mistakes
- Using data points from the table that do not lie exactly on the line.
- Using a triangle that is too small (covering less than half the drawn line).
- Misplacing decimal points when working with values like .
Things to Be Careful About
- Keep track of significant figures and decimal places carefully when computing reciprocals and gradients.
The mass of the metre rule can be calculated using the equation:
Use your value of in (b)(ii) to calculate .
= ______
Working
Using :
Answer
120 g (allow 110 g to 130 g)
Walkthrough
- Substitute the gradient obtained in part (b)(ii) into the given equation:
- With :
- Calculate :
- The mark scheme accepts any correctly calculated value in the range .
Key Takeaways
- Carry forward intermediate gradient values accurately into derived formula calculations.
Common Mistakes
- Division errors when dividing by small decimal numbers or standard form.
Things to Be Careful About
- Ensure the order of operations is followed: perform first, then subtract from .
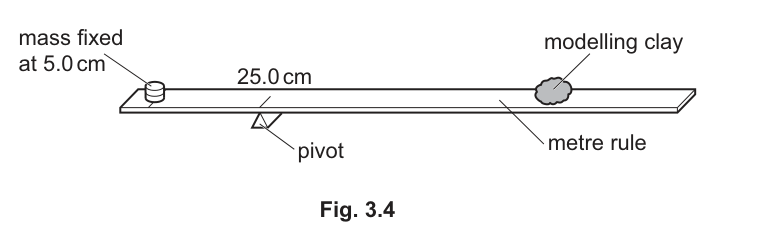
The student is given a piece of modelling clay. He places it on the metre rule as shown in Fig. 3.4. He finds that the metre rule is balanced when the modelling clay is a distance of 40.0 cm from the pivot.
Using your graph in Fig. 3.3 on page 13, find the mass of the piece of modelling clay. Show your working.
mass of piece of modelling clay = ______
Working
For the modelling clay, :
From the graph at , reading the corresponding mass on the x-axis gives:
Answer
28.0 g (allow 25.0 g to 31.0 g)
Walkthrough
- The distance of the modelling clay from the pivot is .
- Calculate the corresponding y-value for the graph:
- Locate on the vertical () axis of your graph in Fig. 3.3.
- Draw a horizontal guide line to intercept the best-fit line, and read down vertically to the horizontal mass axis ().
- The value on the x-axis corresponds to (the mark scheme accepts , i.e., to ).
Key Takeaways
- When given a physical variable not plotted directly on the graph (here ), convert it to the plotted variable (here ) before reading from the line.
Common Mistakes
- Attempting to locate directly on the y-axis instead of first calculating .
Things to Be Careful About
- Show clear construction lines or working indicating how was located and converted to mass.
A student uses ice cubes to investigate the time taken for different masses of ice to melt when the ice cubes are placed in water.
Plan an experiment using ice cubes to investigate how the mass of ice affects the time taken for the ice to melt.
The following apparatus is available:
- top pan balance
- supply of ice cubes
- 250 beaker
- supply of cold water
- stopwatch
You may also use other apparatus and materials that are usually available in a school laboratory.
In your plan, you should:
- explain briefly how to do the investigation
- state the key variables to keep constant
- draw a table, with column headings, to show how to display readings (you are not required to enter any readings in the table)
- explain how to use these readings to reach a conclusion.
You do not have to include a diagram of the apparatus you use but you may do so if it helps your plan.
Method
- Fill the beaker with a fixed volume of cold water.
- Measure the mass of the ice cubes using the top pan balance and record it as .
- Add the ice to the water and start the stopwatch at the same moment.
- Stop the stopwatch when all the ice has completely melted; record the time .
- Repeat steps 2–4 with different masses of ice (for example, 1, 2, 3, 4 and 5 cubes), measuring the mass each time.
Key variables to keep constant
- Initial temperature of the water
- Initial volume (or mass) of the water
- Room temperature
- Use the same beaker, with no added insulation
Results table
| Mass of ice / g | Time for ice to melt / s |
|---|---|
Conclusion
Compare the times for the different masses, or plot a graph of time taken against mass of ice. If the time increases as the mass increases (the graph is not horizontal), then the mass of ice affects the time taken to melt.
See working — full plan covering the method, controlled variables, a results table and how the readings lead to a conclusion.
Walkthrough
This is a planning question: you are not told what happens, you must decide what to do, what to keep the same, what to record, and how to judge the result. Identify the three types of variable first. The independent variable is the mass of ice (or the number of cubes) — it is what you deliberately change. The dependent variable is the time taken for the ice to melt — it is what you measure. Everything that could affect the melting rate other than the mass is a controlled variable.
The mark scheme awards one mark for each of six features, so your plan must contain all of them:
- Method (MP1, MP2, MP3): measure the mass of the ice with the top pan balance, add the ice to the water, time how long it takes to disappear completely, and repeat with a range of different masses. The repeat step is what converts a single reading into a reliable investigation.
- Controlled variables (MP4): the mark scheme accepts any one of several, but a strong plan lists several. The initial temperature of the water matters because warmer water melts ice faster. The initial volume (or mass) of water matters because more water holds more thermal energy, so it can melt more ice. The room temperature and the insulation of the beaker also change the rate at which thermal energy reaches the ice.
- Table (MP5): two columns — mass (or number of cubes) with its unit, and time with its unit. Putting the unit in the column heading is the 5054 convention; it keeps the body of the table as numbers only.
- Conclusion (MP6): either compare the times directly, or — more convincingly — plot time against mass. If larger masses take longer (the graph trends upwards, not horizontally), the mass of ice does affect the melting time. The conclusion must say which way the relationship goes and refer to the data or graph.
Key Takeaways
- A plan must name the independent, dependent and controlled variables before describing the procedure.
- The method must include measuring the independent variable (mass), timing the dependent variable, and repeating over a range of values.
- Controlled variables are the things that would otherwise change the melting rate — water temperature, water volume, room temperature, insulation.
- A results table shows column headings with units, not readings in the headings.
- The conclusion links the pattern in the data (or the slope of the graph) to the physics: more ice needs more thermal energy, so it takes longer.
Common Mistakes
- Missing the controlled variables entirely — MP4 is lost.
- Giving a table without units in the headings — MP5 is lost.
- Ending with "the mass affects the time" without saying how the readings or graph show it — MP6 is lost.
- Not saying that the experiment is repeated for different masses — MP3 is lost.
- Using hot or boiling water — the question specifies cold water, and a consistent initial temperature is part of the control.
- Forgetting to state how the end point is judged (all ice fully melted).
Things to Be Careful About
- The time is the dependent variable — it is read off the stopwatch, not calculated.
- The independent variable can be recorded as a mass (using the balance) or as the number of cubes; the mark scheme accepts both, but measuring the mass gives a true mass–time relationship.
- Keep the controlled variables genuinely constant — for example, the same volume of water and the same beaker for every run.
- Write the table headings as "quantity / unit" (e.g. "Mass of ice / g"), which is the convention expected on Papers 3 and 4.
- Room temperature is a controlled variable, not something to be varied — changing it would change the melting rate between runs and spoil the comparison.