Physics 5054/32 — October/November 2024
Cambridge O-Level · Practical Test · worked solutions for every part, with the mark scheme
Topics Observations and Measurements · Use of Techniques, Apparatus and Materials · Analysis, Conclusions and Evaluation · Experimental Contexts · Planning Experiments and Investigations
In this experiment you will determine an approximate value for the density of the glass from which a test-tube is made.
You are provided with:
- a test-tube
- a 250 glass beaker containing water
- a 30 cm ruler
- a 100 measuring cylinder
- 2 rectangular blocks of wood
- access to a balance.
The height and the external diameter of the test-tube are shown in Fig. 1.1.
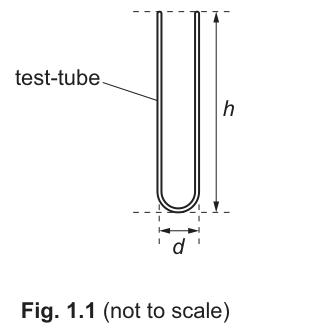
Use the balance to measure the mass of the test-tube. Record your answer to the nearest gram.
= ______
Answer
Candidate's reading, to the nearest gram. Example: 14 g.
Candidate's reading, to the nearest gram (e.g., 14 g)
Walkthrough
The candidate places the test-tube on the balance pan and reads the mass. The mark scheme requires the value to be recorded to the nearest gram (whole number).
Key Takeaways
Always record balance readings to the precision of the balance, here specified as the nearest gram.
Common Mistakes
Recording the mass to an incorrect number of decimal places (e.g., 14.0 g or 14.00 g) when the question specifies the nearest gram.
Things to Be Careful About
Ensure the balance is zeroed before use. Allow for any zero error if present. Record the value exactly as the scale indicates to the nearest whole number.
Measure the height of the test-tube. Record your answer to the nearest 0.1 cm.
= ______
Answer
Candidate's reading, to the nearest 0.1 cm. Example: 9.2 cm.
Candidate's reading, to the nearest 0.1 cm (e.g., 9.2 cm)
Walkthrough
The candidate uses the 30 cm ruler to measure the full height of the test-tube. The mark scheme requires the value in centimetres to the nearest millimetre, which is 0.1 cm.
Key Takeaways
Rulers with mm divisions should be read to 0.1 cm, including a trailing zero if the measurement falls exactly on a centimetre mark (e.g., 9.0 cm, not 9 cm).
Common Mistakes
Reading to the nearest cm (e.g., 9 cm) instead of 0.1 cm, or failing to include a trailing zero (e.g., writing 9.0 as 9).
Things to Be Careful About
Align the ruler carefully with the base and the top rim of the test-tube. Read at eye level to avoid parallax error. Ensure the zero end of the ruler is at the base.
Measure and record the external diameter of the test-tube.
Use the two wooden blocks to help you.
= ______
Answer
Candidate's reading, to the nearest 0.1 cm. Example: 1.6 cm.
Candidate's reading, to the nearest 0.1 cm (e.g., 1.6 cm)
Walkthrough
The external diameter is measured by placing the test-tube between the two rectangular wooden blocks and pushing the blocks against it. The distance between the inner faces of the blocks is then read off the ruler. This value is recorded to the nearest 0.1 cm.
Key Takeaways
Wooden blocks can act as simple callipers to measure the diameter of a cylindrical object more accurately than just placing a ruler across it.
Common Mistakes
Not pushing the blocks firmly against the test-tube, leading to an inaccurate diameter. Reading the ruler to the wrong precision.
Things to Be Careful About
Ensure the blocks are parallel to each other and aligned with the diameter of the test-tube. Read the ruler at eye level to avoid parallax.
Draw a diagram to show how you use the wooden blocks to help you obtain your measurement of in (iii).
Answer
The diagram shows a top-down view of the test-tube placed between the two wooden blocks. The blocks are pushed against the sides of the test-tube along its length. A ruler is placed across the two blocks, perpendicular to the test-tube's length, to measure the distance between the inner faces of the blocks, which equals the external diameter .
See diagram showing test-tube between blocks with ruler across them
Walkthrough
The candidate must draw a diagram illustrating how the wooden blocks are used. A top-down view is clearest. The test-tube is drawn as a circle (or two parallel lines for the walls) between two rectangular blocks. The blocks are shown touching the test-tube. A ruler is drawn across the blocks, with its edge aligned to measure the gap between the inner faces of the blocks.
Key Takeaways
Diagrams in practical questions must clearly show the apparatus and how it is used to make the measurement. Labels are essential.
Common Mistakes
Drawing the blocks touching each other with the test-tube inside, but not showing the ruler. Drawing a side view instead of a top-down view, which makes the diameter measurement unclear. Forgetting to label the diagram.
Things to Be Careful About
The mark scheme specifically looks for the test-tube touching the blocks along its length and the ruler across the blocks. Ensure the drawing is neat and clearly shows these elements.
The shape of the test-tube is approximately a cylinder.
Calculate the external volume of the test-tube using the equation:
= ______
Working
Using the example values and :
Answer
Candidate's calculation using their own values. Example: 18.6 cm.
Candidate's calculation using their own values (e.g., 18.6 cm)
Walkthrough
The candidate substitutes their measured values for and into the provided equation . The constant 0.79 is an approximation for (since the area of a circle is , and 0.79 is used for simplicity). The result is the external volume of the cylindrical test-tube.
Key Takeaways
Always use the exact formula given in the question. Carry out calculations with full precision and round only at the end if required.
Common Mistakes
Using the wrong values for and . Forgetting to square . Using the wrong order of operations.
Things to Be Careful About
Ensure the units are consistent (both and in cm, giving in cm). The mark scheme accepts the calculation correct using candidate values, so ecf (error carried forward) from earlier parts is allowed.
Fill the test-tube to the top with water.
Pour the water carefully from the test-tube into the measuring cylinder.
Read and record the volume of water in the measuring cylinder.
This is the internal volume of the test-tube.
= ______
Answer
Candidate's reading, to the nearest cm. Example: 12 cm.
Candidate's reading, to the nearest cm (e.g., 12 cm)
Walkthrough
The test-tube is filled with water, and the water is poured into the measuring cylinder. The volume of water is read off the cylinder. The mark scheme requires the value to the nearest cm and notes it must be less than .
Key Takeaways
Measuring cylinders have limited precision. Read the meniscus at eye level for accurate volume readings.
Common Mistakes
Reading the meniscus from above or below eye level. Recording to the wrong precision (e.g., 12.0 cm if the cylinder only has 1 cm divisions).
Things to Be Careful About
Ensure all water is transferred from the test-tube to the measuring cylinder. The value must be less than calculated in part (b), as the glass occupies some volume. Record to the nearest cm as specified.
Working
Using the example values and :
Answer
Candidate's calculation using their own values. Example: 6.6 cm.
Candidate's calculation using their own values (e.g., 6.6 cm)
Walkthrough
The volume of the glass is found by subtracting the internal volume (the capacity) from the external volume (the space the test-tube occupies). This gives the actual volume of the glass material.
Key Takeaways
The volume of a hollow object's material is the difference between its external and internal volumes.
Common Mistakes
Adding the volumes instead of subtracting. Using incorrect values from previous parts.
Things to Be Careful About
Ensure the subtraction is done correctly. The result must be positive and less than . The mark scheme allows ecf from parts (b) and (c).
Suggest one source of inaccuracy in measuring the internal volume of the test-tube .
______
Answer
Any one of:
- Cannot tell exactly when the test-tube is full.
- Water may be spilled during transfer from test-tube to measuring cylinder.
- Water may stick to the side of the measuring cylinder or beaker (leaving less water than actually poured).
- The measuring cylinder only reads to the nearest 1 cm.
- Water may remain in the test-tube after pouring.
See working for acceptable answers (e.g., water spilled on transfer)
Walkthrough
The question asks for a source of inaccuracy in measuring . The method involves filling the test-tube and pouring the water into a measuring cylinder. Potential errors include: not filling it completely, spilling water during the pour, water clinging to the glass surfaces (adhesion) so not all water transfers, or the limited precision of the measuring cylinder.
Key Takeaways
In practical experiments, identify how the method itself introduces error. Think about the physical properties of the materials (e.g., water sticking to glass) and the limitations of the apparatus.
Common Mistakes
Giving vague answers like 'human error' or 'be more careful'. The mark scheme rejects these. Must be specific to the method.
Things to Be Careful About
Ensure the answer is a valid source of inaccuracy specific to measuring the internal volume , not the mass or dimensions. Any one valid point scores.
Use your results from (a)(i) and (d) to calculate the density of the glass from which the test-tube is made. Use the equation:
Give the unit for your answer.
= ______ unit ______
Working
Using the example values and :
Answer
Candidate's calculation using their own values. Example: 2.1 g/cm. Unit: g/cm.
Candidate's calculation using their own values (e.g., 2.1 g/cm)
Walkthrough
The density of the glass is calculated by dividing the mass of the test-tube by the volume of the glass. The mass is in grams and the volume is in cm, so the unit for density is g/cm. The mark scheme awards one mark for the correct calculation and one mark for the correct unit.
Key Takeaways
Density is mass per unit volume. Always include the correct unit in the final answer. For mass in g and volume in cm, the unit is g/cm.
Common Mistakes
Forgetting to state the unit. Using the wrong volume (e.g., instead of ). Incorrect arithmetic.
Things to Be Careful About
The question explicitly asks for the unit. Both the numerical value and the unit are required for full marks. The mark scheme allows ecf from parts (a)(i) and (d). Typical glass density is around 2.2-2.8 g/cm, so the answer should be in this region if the measurements are reasonable.
In this experiment you will investigate how the resistance of a light-emitting diode (LED) changes with different currents.
You are provided with:
- a power source
- a switch
- a voltmeter with two leads that may be connected between different points in the circuit shown in Fig. 2.1
- a light-emitting diode (LED)
- a 270 resistor, a 470 resistor and a 560 resistor
- sufficient connecting leads to make the circuit shown in Fig. 2.1.
The supervisor has set up the circuit shown in Fig. 2.1. The 270 resistor is connected in the circuit and the 470 resistor and the 560 resistor are placed by the side of the circuit.
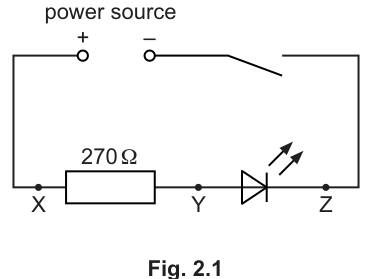
Connect the voltmeter across the 270 resistor between points X and Y.
Ensure that the positive terminal of the voltmeter is connected to X.
Close the switch.
Record the voltmeter reading in the top row of Table 2.1.
Open the switch.
Table 2.1
| resistance between X and Y / | / | / | ( + ) / | / | / |
|---|---|---|---|---|---|
| 270 | |||||
| 470 | |||||
| 560 |
Answer
Connect the voltmeter across points X and Y, with the positive terminal to X. Close the switch and record the reading.
Representative value:
2.5 V (candidate-dependent reading)
Walkthrough
The candidate must set up the circuit to measure the potential difference across the resistor. The voltmeter is connected in parallel with the resistor, between terminals X and Y. The positive terminal of the voltmeter must connect to X (the side closer to the positive terminal of the power source) to ensure a positive reading. After closing the switch, the candidate reads the voltmeter to the precision of the instrument (typically to or depending on the dial) and records it in the top row of Table 2.1. In this worked example, a representative reading of is used.
Key Takeaways
Voltmeters are always connected in parallel with the component whose potential difference is being measured. The positive terminal of the voltmeter must connect to the side of the component closer to the positive terminal of the power source to avoid a negative reading.
Common Mistakes
- Connecting the voltmeter in series with the circuit, which would give a very high resistance and prevent current from flowing normally.
- Reversing the voltmeter terminals, resulting in a negative reading on an analogue meter or a negative value on a digital one.
- Reading the wrong scale on an analogue voltmeter (e.g. reading the scale instead of ).
Things to Be Careful About
Record the reading to the precision of the instrument. If the scale has divisions, record to one decimal place (e.g. , not ). Ensure the switch is open while making connections, and only close it briefly to take the reading to prevent the components from heating up and changing resistance.
Disconnect the voltmeter from points X and Y.
Reconnect the voltmeter across the LED between points Y and Z.
Ensure that the positive terminal of the voltmeter is connected to Y.
Close the switch.
Record the voltmeter reading in the correct row of Table 2.1.
Open the switch.
Answer
Disconnect the voltmeter from X and Y. Connect it across Y and Z, with the positive terminal to Y. Close the switch and record the reading.
Representative value:
1.8 V (candidate-dependent reading, must be < V_XY)
Walkthrough
The candidate now measures the potential difference across the light-emitting diode (LED). The voltmeter is reconnected in parallel with the LED, between terminals Y and Z. Again, the positive terminal of the voltmeter must connect to Y (closer to the positive terminal of the power source). The candidate records this reading in the second column of Table 2.1. For a typical LED at this current, the voltage drop is less than the voltage drop across the resistor, so a representative value of is used here (must be less than ).
Key Takeaways
The potential difference across the LED is typically lower than across the series resistor in this setup. The total potential difference provided by the source is shared between the resistor and the LED: .
Common Mistakes
- Forgetting to reconnect the voltmeter to the correct terminals (Y and Z instead of X and Y).
- Not changing the range on the voltmeter if it is multi-range (though most modern school voltmeters are auto-ranging).
Things to Be Careful About
Maintain the same precision as in part (a). The reading must be less than for the first row, as the LED has a lower resistance than the resistor at this current. Ensure the switch is open when changing connections.
Remove the 270 resistor from the circuit and replace it with the 470 resistor.
Repeat the procedures in (a) and (b) for the 470 resistor.
Remove the 470 resistor from the circuit and replace it with the 560 resistor.
Repeat the procedures in (a) and (b) for the 560 resistor.
Answer
Remove the resistor and replace it with the resistor. Repeat parts (a) and (b) to record and . Then replace with the resistor and repeat again.
Representative readings:
- For : ,
- For : ,
Complete set of readings obtained for all three resistor values
Walkthrough
To investigate how the LED resistance changes with current, the candidate must vary the current in the circuit. This is done by changing the resistance of the fixed resistor in series with the LED. The candidate removes the resistor and replaces it with the resistor, repeating the voltmeter connections and readings. This is done again for the resistor. This provides three different current values to analyze.
Key Takeaways
Changing the series resistor alters the total resistance of the circuit, which changes the current according to Ohm's law. This allows the candidate to observe how the LED's resistance (which is non-ohmic) changes at different operating currents.
Common Mistakes
- Not opening the switch before replacing resistors, which could cause a short circuit or damage components.
- Forgetting to record the new resistor value in the first column of the table.
Things to Be Careful About
Ensure the new resistor is firmly connected in the circuit between X and Y. Handle components carefully to avoid damaging the LED or the resistors. Allow the circuit to reach a steady state before taking readings, but do not leave the switch closed for too long to prevent heating.
For each value of resistance between X and Y, calculate the value of ().
Record your answers in Table 2.1.
Working
Calculate for each row.
- Row 1 ():
- Row 2 ():
- Row 3 ():
Answer
Record in the fourth column for all rows.
4.3 V for all rows
Walkthrough
By Kirchhoff's second law, the sum of the potential differences across components in a series circuit equals the total e.m.f. of the power source. Therefore, should be approximately constant and equal to the supply voltage. The candidate adds the two voltage readings for each row and records the result in the fourth column of Table 2.1. In this example, the sum is for all rows, indicating a supply voltage of approximately (likely three cells in series with some internal resistance or slight variations).
Key Takeaways
In a series circuit, the total potential difference is the sum of the potential differences across each component. This provides a check on the readings: the sum should be roughly constant.
Common Mistakes
- Forgetting to include the unit in the answer.
- Adding the values incorrectly.
Things to Be Careful About
The sum may not be exactly constant due to internal resistance of the power source or slight variations in readings. A small variation (e.g. to ) is acceptable.
The current in the circuit in part (a) can be calculated using the equation:
where is the resistance between X and Y.
Calculate for , and .
Record your answers in Table 2.1.
Working
Use for each row.
- For :
- For :
- For :
Answer
Record these values in the fifth column. Note that is decreasing.
9.3 mA, 3.8 mA, 2.7 mA (I decreasing)
Walkthrough
The current in the series circuit is the same everywhere. Since the voltage across the fixed resistor and its resistance are known, the current can be calculated using Ohm's law: . The candidate performs this calculation for each of the three resistor values. As the resistance increases, the current decreases, which is reflected in the calculated values. The answers should be recorded in the table, typically in amperes (e.g. ) or milliamperes (e.g. ), depending on the table's expected format.
Key Takeaways
Ohm's law () can be rearranged to find current. In a series circuit, the current is determined by the total voltage and total resistance, but here it is calculated from the known resistor and its voltage drop.
Common Mistakes
- Forgetting to convert the answer to a suitable unit (e.g. writing without units or not converting to mA if the table implies it).
- Using the wrong voltage value (e.g. using instead of ).
Things to Be Careful About
Keep at least 2 or 3 significant figures in intermediate calculations to avoid rounding errors. The mark scheme requires the candidate to note that is decreasing, which demonstrates understanding of the trend.
The resistance of the LED can be calculated using the equation:
Calculate for each value of resistance between X and Y.
Record your answers in Table 2.1.
Working
Use for each row.
- For :
- For :
- For :
Answer
Record these values in the last column. Note that is increasing.
194 Ω, 653 Ω, 1045 Ω (R_LED increasing)
Walkthrough
The resistance of the LED at each operating point is calculated using the voltage across it () and the current through it (). Using , the candidate finds that as the current decreases, the calculated resistance of the LED increases significantly. This is characteristic of a semiconductor diode: its resistance is not constant but depends on the operating current.
Key Takeaways
The resistance of an LED is not a fixed value; it is dynamic and changes with the current flowing through it. At lower currents, the effective resistance is higher.
Common Mistakes
- Using the wrong current value (e.g. using the current from a different row).
- Rounding intermediate values too early, leading to large errors in the final resistance.
- Not noting the trend that is increasing.
Things to Be Careful About
Use the unrounded current values from part (e) for this calculation to maintain accuracy. Report the resistance to 2 or 3 significant figures.
As the resistance between terminals X and Y changes, the current in the circuit changes.
Examine your results in Table 2.1.
Describe how the change in current affects:
Answer
() remains constant.
Remains constant
Walkthrough
Looking at the fourth column of the table, the sum is approximately for all three rows. This value represents the total e.m.f. of the power source. As the current changes by altering the series resistance, the voltage is redistributed between the resistor and the LED, but their sum remains equal to the supply voltage.
Key Takeaways
Kirchhoff's second law states that the sum of potential differences in a closed loop equals the source e.m.f. This is demonstrated by the constant sum in the table.
Common Mistakes
- Saying the sum increases or decreases.
- Not stating 'remains constant' but giving a vague description.
Things to Be Careful About
The sum may vary slightly due to experimental error, but the conclusion should be that it remains constant (within experimental uncertainty).
Answer
As the current decreases, the resistance of the LED () increases.
As current decreases, resistance increases
Walkthrough
Examining the last column, the calculated resistance of the LED increases from to to as the current decreases from to to . This shows that the LED is a non-ohmic component: its resistance is not constant but increases as the current through it decreases.
Key Takeaways
Semiconductor devices like LEDs do not obey Ohm's law. Their resistance depends on the operating conditions (current and voltage). Specifically, for an LED, the dynamic resistance increases at lower currents.
Common Mistakes
- Saying the resistance decreases (confusing the relationship).
- Not linking the change in resistance to the change in current (e.g. just saying 'resistance increases' without mentioning current).
Things to Be Careful About
Use the word 'decreases' or 'increases' clearly to describe the trend. The relationship is inverse: lower current means higher resistance.
A student assembles a circuit using the circuit diagram shown in Fig. 2.1. The student finds that, when the switch is closed, the LED does not light up.
The student tests the components and finds that the power source is producing an e.m.f. and that none of the other components are broken.
Suggest the error the student has made while assembling the circuit.
______
Answer
The diode is connected the wrong way around (the anode and cathode are reversed), or the battery/power source is connected the wrong way around. Alternatively, the voltmeter is connected in series instead of in parallel.
Diode connected the wrong way around
Walkthrough
An LED only allows current to flow in one direction: from the anode (positive side) to the cathode (negative side). If the LED is connected in reverse bias (cathode to positive, anode to negative), it will not conduct current, and therefore will not light up. Since the power source is producing an e.m.f. and other components are not broken, the most likely error is that the LED or the power source is connected with reversed polarity. Another possibility is that the voltmeter was incorrectly left in series in the circuit, which would prevent normal current flow due to the voltmeter's very high resistance.
Key Takeaways
Diodes are directional components. They must be connected with the correct polarity to conduct and function. In a circuit, a reversed diode acts like an open switch.
Common Mistakes
- Suggesting the resistor is the wrong value (the question states all components are not broken and the source works).
- Suggesting the switch is faulty.
- Not specifying which component is reversed (e.g. just saying 'reversed' without saying the diode or battery).
Things to Be Careful About
The LED symbol has a triangle pointing in the direction of conventional current flow (anode to cathode). The cathode is marked by the flat side or a line. Ensure the explanation clearly identifies the polarity error.
In this experiment you will investigate the image formed by a converging lens.
You are provided with:
- a converging lens in a lens holder
- a metre rule
- a 30 cm ruler
- a white screen
- a triangular object in a piece of white card
- a lamp with a power supply, to illuminate the triangular object.
Arrange the apparatus as shown in Fig. 3.1.
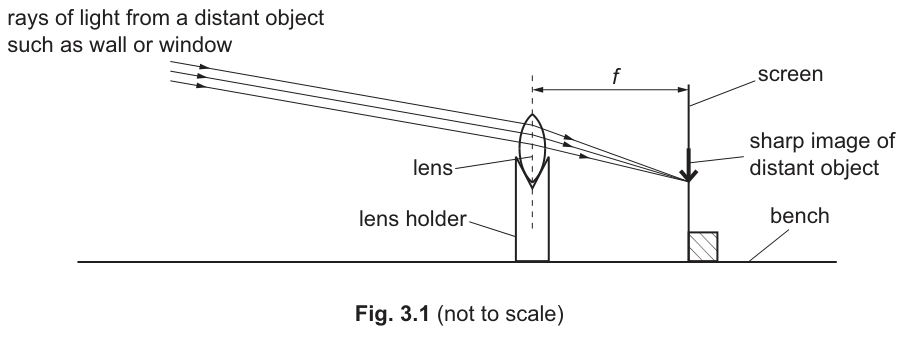
Place the white screen approximately 30 cm from the lens.
Adjust the position of the screen until a sharp image of the wall or the window of the laboratory, a few metres distant from the lens, is formed on the screen.
Measure and record, in centimetres to the nearest 0.1 cm, the distance from the lens to the screen.
This distance is the focal length of the lens.
= ______
Answer
15.0 (accept 13.5 to 16.5)
15.0
Walkthrough
To find the focal length of a converging lens, place the lens between a distant object (like a window or wall several metres away) and a screen. Because the object is far away, the incident rays are effectively parallel. The lens focuses these parallel rays to a sharp image on the screen at its focal point. The distance from the centre of the lens to the screen where the sharp image forms is the focal length . Measure this distance using the metre rule and record it to the nearest 0.1 cm. A typical value for this lens is around 15.0 cm.
Key Takeaways
A converging lens focuses parallel rays from a distant object to its principal focus. The distance from the lens to this sharp image is the focal length.
Common Mistakes
- Not waiting until the image is truly sharp before measuring.
- Recording the measurement without the required precision (nearest 0.1 cm).
- Measuring from the edge of the lens holder instead of the centre of the lens.
Things to Be Careful About
Always read the scale at eye level to avoid parallax error. Ensure the screen is perpendicular to the bench. The value should be around 15.0 cm; any value between 13.5 cm and 16.5 cm is acceptable.
Rearrange the apparatus as shown in Fig. 3.2.
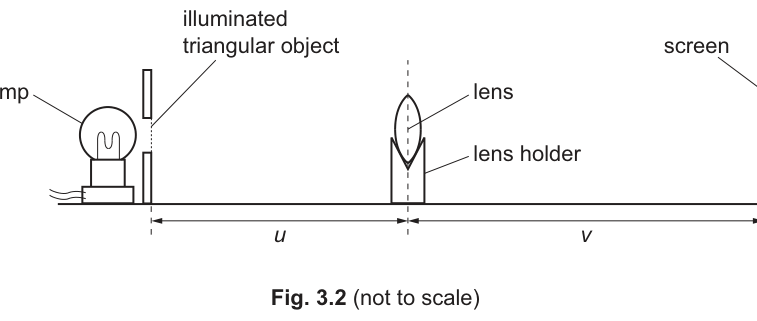
Switch on the lamp.
Place the lens a distance from the illuminated triangular object.
Adjust the position of the screen until a sharp image of the triangular object is formed on the screen.
Measure, to the nearest 0.1 cm, the image distance from the lens to the screen.
= ______
Answer
60.0 (accept value around 60.0)
60.0
Walkthrough
With the object placed at cm from the lens, move the screen along the bench until a sharp, focused image of the triangular object appears. Measure the distance from the centre of the lens to the screen. This is the image distance . Using the lens equation with cm and cm, we get , so cm. Record this value to the nearest 0.1 cm (nearest millimetre).
Key Takeaways
Image distance is measured from the lens centre to the screen where a sharp real image is formed.
Common Mistakes
- Reading the scale from an angle (parallax error).
- Not recording the value to the required precision (nearest 0.1 cm).
Things to Be Careful About
Ensure the object, lens, and screen are all aligned on the same horizontal line and perpendicular to the metre rule. Read the scale at eye level.
Working
Answer
(u + v) = 80.0, uv = 1200
Walkthrough
Using the measured values cm and cm, calculate the two quantities required for the graph:
- Sum:
- Product:
These values will be used in the subsequent parts of the experiment.
Key Takeaways
Calculating derived quantities like and simplifies the analysis of lens data.
Common Mistakes
- Arithmetic errors in multiplication or addition.
- Forgetting to include units in the final answer if required (though the table headers handle this).
Things to Be Careful About
Use the exact recorded values for and , not rounded values. Keep sufficient significant figures.
Repeat (b)(i) and (b)(ii) for values of between and .
Record all your values in Table 3.1. Include your readings from (b).
Add appropriate units to the headers of the last two columns.
Table 3.1
| / | / | () / ______ | / ______ |
|---|---|---|---|
Answer
| / cm | / cm | / cm | / cm |
|---|---|---|---|
| 20.0 | 60.0 | 80.0 | 1200 |
| 25.0 | 40.0 | 65.0 | 1000 |
| 30.0 | 30.0 | 60.0 | 900 |
| 40.0 | 24.0 | 64.0 | 960 |
| 50.0 | 21.4 | 71.4 | 1070 |
| 60.0 | 20.0 | 80.0 | 1200 |
The last two column headers are cm and cm. The table shows that as increases, decreases.
Table completed with units cm and cm^2; data shows v decreasing as u increases.
Walkthrough
Repeat the measurements for values between 25.0 cm and 60.0 cm. For each , adjust the screen to find the sharp image and record . Calculate and for each row.
- Add the correct units to the column headers: is a distance, so cm. is a product of two distances, so cm.
- Include the data from part (b)(i) () as the first row.
- Ensure the data shows the correct trend: as the object distance increases, the image distance decreases.
Key Takeaways
Results tables must have clear headers with units. Derived quantities must be calculated consistently.
Common Mistakes
- Forgetting to add units to the table headers.
- Not including the data from part (b) in the table.
- Recording data that does not show decreasing as increases.
Things to Be Careful About
Use a consistent number of decimal places (one decimal place is appropriate here). Ensure calculations are correct.
On the grid provided in Fig. 3.3 on page 11, plot a graph of on the y-axis against () on the x-axis.
You do not need to start either axis from the origin (0, 0). Draw the straight line of best fit.
Answer
Graph of (y-axis) against (x-axis) with points plotted and a straight line of best fit drawn.
Graph plotted with axes labelled and units, points accurate, straight line of best fit drawn.
Walkthrough
Plot the data from Table 3.1 on the provided grid.
- y-axis: label as / cm. Choose a scale that uses at least half the grid (e.g., 0 to 1400 in steps of 200).
- x-axis: label as / cm. Choose a scale (e.g., 50 to 90 in steps of 5 or 10).
- Plot each pair as a point. Ensure points are plotted to within half a small square.
- Draw a thin, straight line of best fit. The data should form a straight line (or very close to it), reflecting the relationship .
Key Takeaways
Graphs must have clearly labelled axes with quantity and unit. Scales must be linear and not awkward. Points must be plotted accurately, and a line of best fit must be drawn.
Common Mistakes
- Forgetting to label axes with units.
- Using an awkward scale (e.g., steps of 3 or 7).
- Plotting points inaccurately (more than half a square off).
- Drawing a curve instead of a straight line of best fit.
Things to Be Careful About
Do not necessarily start the axes at (0,0) if it wastes space, but ensure the scales are logical. Use a sharp pencil for plotting and a ruler for the line of best fit.
Calculate the gradient of the line.
Indicate on the graph the points you use.
Show all your working.
gradient = ______
Working
Select two points on the line of best fit, for example: and .
Answer
gradient = 15.0
15.0
Walkthrough
To calculate the gradient of the straight line of best fit, choose two points that lie exactly on the line (not necessarily data points), ideally as far apart as possible to minimize error. For example, use and .
The gradient is numerically equal to the focal length in cm. Mark these two points on the graph and show the triangle used for the calculation.
Key Takeaways
The gradient of a graph is . Always use points on the line of best fit, not raw data points.
Common Mistakes
- Using two data points that are not on the line of best fit.
- Calculating the gradient as a single coordinate () instead of .
- Not indicating the points used on the graph.
Things to Be Careful About
The gradient triangle must have sides half the length of the line drawn. Show all working clearly.
Two quantities can be considered to be the same within the limits of experimental accuracy if their values are within 10% of each other.
The gradient of your line calculated in (e) is numerically equal to the focal length of the lens in cm.
Compare your value of obtained in (a) with the value of the gradient obtained in (e).
State if your two values can be considered to be the same.
Support your statement with a calculation.
calculation
statement ______
Working
Value of from (a) = 15.0 cm
Gradient from (e) = 15.0 cm
Since , the values are the same.
Answer
calculation:
statement: The two values can be considered to be the same.
Calculation shows 0% difference, which is within 10%, so the values are the same.
Walkthrough
The question states that two quantities are the same within experimental accuracy if their values are within 10% of each other. Calculate the percentage difference between the focal length measured in part (a) and the gradient calculated in part (e).
Using and gradient :
Since is less than , the statement is that the two values can be considered to be the same.
Key Takeaways
Experimental results can be compared using percentage difference. If the difference is within the specified tolerance, the results agree.
Common Mistakes
- Using the wrong formula for percentage difference.
- Forgetting to take the absolute value.
- Stating the values are different without performing the calculation.
Things to Be Careful About
Ensure the calculation uses both values of (from part a and part e). The statement must match the calculation.
When measuring the object and image distances with the metre rule, it is important to avoid line-of-sight (parallax) errors.
State how you avoid parallax errors when doing this experiment.
______
Answer
View the scale reading at right angles (at eye level / perpendicularly / directly from above).
View the scale reading at right angles / at eye level.
Walkthrough
Parallax error occurs when a reading is taken from an angle, causing the apparent position of the object to shift relative to the scale. To avoid this when measuring distances with a metre rule, the observer must position their eye so that the line of sight is perpendicular to the scale. This means viewing the rule at right angles, at eye level, or directly from above.
Key Takeaways
Parallax error is avoided by viewing measurements at right angles to the scale.
Common Mistakes
- Stating 'be more careful' or 'use better apparatus' (these are not specific techniques).
- Not mentioning the direction of view (right angles / eye level).
Things to Be Careful About
The answer must specifically address how to view the scale. 'At eye level' or 'at right angles' are the key phrases accepted by the mark scheme.
Water is heated from room temperature to its boiling temperature in a glass beaker.
Plan an experiment to investigate if the time taken for the water to reach its boiling temperature depends on the diameter of the water surface exposed to the air.
You are provided with:
- a supply of cold water
- a set of glass beakers of different sizes
- a Bunsen burner, tripod and gauze
- a measuring cylinder.
You may use any other common laboratory apparatus.
You are not required to do this investigation.
In your plan include:
- any other apparatus needed
- a brief description of the method, including what you will measure and how you will make sure your measurements are accurate
- the variables you will control
- a results table to record your measurements (you are not required to enter any readings in the table)
- how you will process your results to draw a conclusion.
You may include a labelled diagram if you wish.
Answer
Additional apparatus
- stopwatch
- ruler or measuring tape
- thermometer
Method
- Measure and record the diameter of the water surface (the top of each beaker) using the ruler or measuring tape.
- Use the measuring cylinder to put the same volume (e.g. 200 cm³) of cold water into each beaker.
- Use the thermometer to check that the initial water temperature is the same for each beaker.
- Place the beaker on the tripod and gauze over the Bunsen burner. Keep the flame at the same setting.
- Start the stopwatch as the water begins heating and stop it when the water boils (bubbles steadily).
- Repeat the timing for each beaker and take an average for accuracy.
Variables to control
- volume of water
- initial water temperature
- Bunsen burner flame setting
Results table
| Diameter / cm | Time / s |
|---|---|
Processing and conclusion
Plot a graph of time (y-axis) against diameter (x-axis). If the graph shows a trend (e.g. time increases with diameter), the time taken to boil depends on the diameter. If the points are horizontal, the time is independent of the diameter.
Plan: measure the diameter of each beaker, heat the same volume of water to boiling and time it; control volume, initial temperature and flame; record diameter and time in a table; plot time against diameter or compare to conclude whether the time depends on the diameter.
Walkthrough
This is a planning question, so no actual measurements are needed. The independent variable is the diameter of the water surface (the variable you change). The dependent variable is the time taken to reach boiling (the variable you measure). Everything else that could affect the time must be controlled.
First, decide what extra apparatus is needed. A stopwatch measures the time, a ruler or measuring tape measures the diameter, and a thermometer checks the initial temperature and that the water boils. The Bunsen burner, tripod, gauze and measuring cylinder are already provided.
The method must be clear enough for another student to follow. Use the measuring cylinder to put the same volume of water into each beaker. Measure the diameter of each beaker. Heat each beaker on the same flame and time how long it takes to boil. Repeating the timing and taking an average makes the measurement more accurate.
Controlling the volume of water, the initial temperature and the flame means that any difference in time can only be caused by the diameter of the water surface.
A results table should have a column for diameter and a column for time, each with its unit. Then process the data by plotting a graph of time against diameter, or by comparing the values in the table. If the graph is not horizontal, the time depends on the diameter; if it is horizontal, it does not.
Key Takeaways
- A plan must clearly identify the independent variable, the dependent variable and the controlled variables.
- Additional apparatus is chosen to measure the quantities involved.
- A results table must include headings with units.
- A conclusion must be justified by the data, usually by plotting a graph or comparing values.
Common Mistakes
- Not controlling the volume or mass of water.
- Not controlling the initial water temperature.
- Not keeping the Bunsen flame constant.
- Forgetting to include units in the results table.
- Not stating how the data will be processed to reach a conclusion.
- Not repeating timings for accuracy.
Things to Be Careful About
- The diameter of the water surface is the same as the internal diameter of the beaker, so measure the opening carefully.
- Use the same volume of water, not the same height of water, because the beaker diameter changes the depth.
- If you repeat the timing, use the average time.
- When plotting a graph, put the variable you change (diameter) on the x-axis and the variable you measure (time) on the y-axis.
- Make sure the thermometer is used to confirm the initial temperature is the same for every beaker.