Physics 5054/42 — May/June 2024
Cambridge O-Level · Alternative to Practical · worked solutions for every part, with the mark scheme
Topics Experimental Contexts · Use of Techniques, Apparatus and Materials · Observations and Measurements · Analysis, Conclusions and Evaluation · Planning Experiments and Investigations
A student investigates the resistance of a diode when different currents flow through it.
The student sets up the circuit shown in Fig. 1.1.
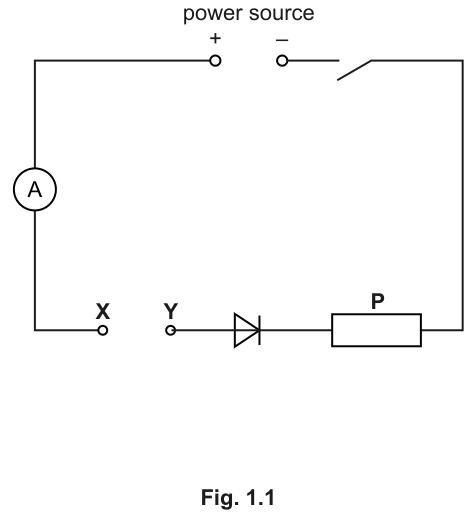
The student connects a voltmeter into the circuit to measure the potential difference (p.d.) across the diode.
On Fig. 1.1, draw the symbol for a voltmeter connected to measure the p.d. across the diode.
Answer
Voltmeter symbol (circle with V) drawn in parallel across the diode, with no other connections.
Walkthrough
A voltmeter must always be connected in parallel with the component whose potential difference (p.d.) is being measured. To measure the p.d. across the diode, draw the standard circuit symbol for a voltmeter — a circle with a capital 'V' inside — and connect its two leads to the two wires on either side of the diode. Ensure the voltmeter is not connected in series anywhere in the circuit, as this would block the current due to its very high resistance.
Key Takeaways
- A voltmeter measures p.d. and is always connected in parallel with the component across which the p.d. is required.
- An ammeter measures current and is always connected in series.
Common Mistakes
- Connecting the voltmeter in series with the diode or anywhere else in the main circuit loop.
- Drawing the symbol incorrectly (e.g., forgetting the 'V' inside the circle).
Things to Be Careful About
- The voltmeter must be connected across the diode specifically, not across the resistor P or the power source. The leads should touch the wire between Y and the diode, and the wire between the diode and resistor P.
The student:
- uses a connecting lead to connect the terminals X and Y together
- closes the switch
- records the voltmeter reading
- records the ammeter reading
- opens the switch and removes the connecting lead.
Fig. 1.2 shows the readings on the voltmeter and the ammeter.
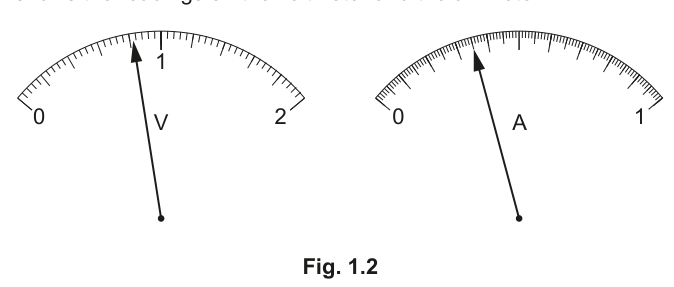
Record the readings shown in Fig. 1.2 in the top row of Table 1.1.
Table 1.1
| resistance between X and Y / | voltmeter reading / | ammeter reading / | resistance of diode / |
|---|---|---|---|
| 0 | |||
| 3.3 | 0.82 | 0.27 | 3.0 |
| 6.8 | 0.81 | 3.7 | |
| 10 | 0.81 | 0.19 |
Answer
| resistance between X and Y / | voltmeter reading / | ammeter reading / | resistance of diode / |
|---|---|---|---|
| 0 | 0.82 | 0.35 | |
| 3.3 | 0.82 | 0.27 | 3.0 |
| 6.8 | 0.81 | 3.7 | |
| 10 | 0.81 | 0.19 |
Voltmeter reading: 0.82 V; Ammeter reading: 0.35 A
Walkthrough
The student connects terminals X and Y directly with a lead, so the only resistance in the circuit (besides the diode and component P) is negligible. The voltmeter measures the p.d. across the diode, and the ammeter measures the current through it.
Voltmeter reading: The scale runs from 0 to 2 V with major markings at 0, 1, and 2. There are 10 small divisions between 0 and 1, so each small division represents 0.1 V. The pointer is past the 0.8 mark, two small divisions past 0.8. Reading to one decimal place beyond the smallest division (or estimating), the reading is 0.82 V.
Ammeter reading: The scale runs from 0 to 1 A with major markings at 0 and 1. There are 50 small divisions between 0 and 1, so each small division represents 0.02 A. The pointer is past 0.3 (15 divisions), and is at the 17.5th division approximately. A. The reading is 0.35 A.
Record these values in the top row of Table 1.1.
Key Takeaways
- Always read analogue meters to the precision the scale allows, including an estimated digit if appropriate.
- Calculate the value of each small division before reading the pointer position.
Common Mistakes
- Reading the wrong scale (e.g., reading the ammeter as 0.35 V).
- Not estimating between divisions when the pointer falls between them.
- Forgetting to include the unit if it is not already in the table heading (though here the units are in the headings).
Things to Be Careful About
- The voltmeter has 10 divisions per volt, so each is 0.1 V. The pointer is slightly past 0.8, giving 0.82 V.
- The ammeter has 50 divisions per ampere, so each is 0.02 A. The pointer is at 17.5 divisions, giving 0.35 A.
Calculate the resistance of the diode using the equation:
Record your answer in the top row of Table 1.1 to an appropriate number of significant figures.
Working
Answer
2.3 (or 2.34 )
2.3
Walkthrough
The resistance of the diode at this current is found using the equation . Using the readings from part (b):
The mark scheme accepts any answer to 2 or 3 significant figures. Rounding to 2 significant figures gives 2.3 . Rounding to 3 significant figures gives 2.34 . Both are acceptable. Record 2.3 in the top row of Table 1.1.
Key Takeaways
- Resistance can be calculated from simultaneous voltage and current readings using .
- The answer should be given to an appropriate number of significant figures, matching the precision of the input data (2 or 3 s.f. here).
Common Mistakes
- Forgetting to include the unit in the final answer.
- Giving the answer to too many significant figures (e.g., 2.342857).
Things to Be Careful About
- Ensure the units are consistent: volts divided by amperes gives ohms.
- The diode is a non-ohmic component, so this resistance is only valid for this specific current and voltage. It is not a constant value.
The student:
- connects a 3.3 resistor between terminals X and Y
- closes the switch
- records the voltmeter reading in Table 1.1
- records the ammeter reading in Table 1.1
- opens the switch and removes the 3.3 resistor
- repeats this procedure for resistors of 6.8 and 10 .
Complete Table 1.1 by inserting the missing values.
Working
For the 6.8 resistor row:
For the 10 resistor row:
Answer
| resistance between X and Y / | voltmeter reading / | ammeter reading / | resistance of diode / |
|---|---|---|---|
| 0 | 0.82 | 0.35 | 2.3 |
| 3.3 | 0.82 | 0.27 | 3.0 |
| 6.8 | 0.81 | 0.22 | 3.7 |
| 10 | 0.81 | 0.19 | 4.3 |
Missing ammeter reading: 0.22 A; Missing resistance: 4.3
Walkthrough
The table has two missing values. The voltmeter reading is always the p.d. across the diode, and the ammeter reading is the current through the diode. The resistance is the calculated resistance of the diode at that operating point.
Row 3 (6.8 resistor):
Given V and . Find .
Rounding to 2 significant figures (matching the data), A.
Row 4 (10 resistor):
Given V and A. Find .
Rounding to 2 significant figures, .
Record these values in the respective empty cells in Table 1.1.
Key Takeaways
- Rearranging allows you to find any missing quantity if the other two are known.
- Always round to an appropriate number of significant figures based on the data provided.
Common Mistakes
- Using the resistance of the external resistor (3.3, 6.8, 10) in the calculation instead of the diode resistance .
- Forgetting to round to 2 significant figures.
Things to Be Careful About
- The column 'resistance of diode ' is calculated from the voltmeter and ammeter readings at the diode, not from the external resistor value. The external resistor simply limits the current in the circuit.
As the resistance between terminals X and Y is changed, the current in the circuit changes.
Examine the results shown in Table 1.1.
Describe how the change in current affects:
Answer
As the current decreases, the voltage across the diode decreases (or there is little/no change in voltage).
As the current decreases, the voltage across the diode decreases (or remains almost constant / little change).
Walkthrough
Look at the 'ammeter reading ' and 'voltmeter reading ' columns in Table 1.1.
- Current decreases: 0.35 A 0.27 A 0.22 A 0.19 A.
- Voltage changes: 0.82 V 0.82 V 0.81 V 0.81 V.
The voltage drops very slightly (from 0.82 to 0.81) as the current decreases. For a diode, the voltage across it changes very little over a wide range of currents once it is forward-biased. The mark scheme accepts 'as the current decreases the voltage across the diode decreases' or '(little or) no change in voltage'. Both describe the data accurately.
Key Takeaways
- Diodes are non-ohmic components. Their voltage-current characteristic is not a straight line through the origin.
- In the forward-bias region, a large change in current produces only a small change in voltage across the diode.
Common Mistakes
- Saying 'voltage increases as current decreases' (contradicts the data).
- Failing to mention the direction of the change (e.g., just saying 'voltage changes').
Things to Be Careful About
- Be precise: the voltage does decrease slightly, but it is often described as 'almost constant' or 'little change' for a diode in this region. Accept either description if justified by the data.
Answer
As the current decreases, the resistance of the diode increases.
As the current decreases, the resistance of the diode increases.
Walkthrough
Look at the 'ammeter reading ' and 'resistance of diode ' columns in Table 1.1.
- Current decreases: 0.35 A 0.27 A 0.22 A 0.19 A.
- Resistance increases: 2.3 3.0 3.7 4.3 .
There is a clear inverse relationship: as the current flowing through the diode decreases, its calculated resistance increases. This is a characteristic property of semiconductor diodes in the forward-bias region.
Key Takeaways
- The resistance of a diode is not constant; it depends on the current flowing through it.
- For a forward-biased diode, resistance is lower at higher currents and higher at lower currents.
Common Mistakes
- Saying 'resistance decreases as current decreases' (contradicts the data).
- Confusing the resistance of the diode with the resistance of the external resistor between X and Y.
Things to Be Careful About
- Ensure the statement clearly links the change in current to the change in resistance (e.g., 'as X decreases, Y increases').
A student sets up a circuit using the diagram shown in Fig. 1.1.
The student finds that, when the connecting lead is connected across the terminals X and Y and the switch is closed, the ammeter does not give a reading.
The ammeter is not broken.
Suggest the error that the student has made while assembling the circuit.
______
Answer
The diode (or power supply / ammeter) is connected the wrong way around (flipped / in the wrong direction), so it is reverse-biased and blocks current. Alternatively, the voltmeter is connected in series in the circuit.
Diode connected the wrong way around (reverse-biased), or voltmeter connected in series.
Walkthrough
The ammeter gives no reading, meaning no current is flowing in the circuit. The ammeter is not broken. We must consider what could cause an open circuit or block the current.
- Diode reversed: A diode only allows current to flow in one direction (forward bias). If the student connected the diode backwards (cathode to the positive terminal side), it will be reverse-biased and act like an open switch, blocking all current. The ammeter would read zero.
- Voltmeter in series: If the student accidentally connected the voltmeter in series with the diode (instead of in parallel), the very high resistance of the voltmeter would prevent any significant current from flowing. The ammeter would read zero (or negligibly small).
- Power supply/ammeter reversed: While this wouldn't necessarily stop current if the diode is forward-biased, if the power supply terminals are swapped such that the diode is reverse-biased, current stops. Similarly, if the ammeter is reversed, it might not read (though modern ammeters often just deflect backwards, analogue ones might peg or read zero if blocked).
The most likely and common error in diode experiments is connecting the diode in the wrong direction (reverse bias).
Key Takeaways
- Diodes are non-ohmic and only conduct in one direction (forward bias).
- A voltmeter has very high resistance and must not be connected in series.
- If a circuit has no current, check for open switches, broken connections, or reverse-biased diodes.
Common Mistakes
- Saying 'the switch is open' (the question implies the switch is closed).
- Saying 'the battery is dead' (not a circuit assembly error).
- Not specifying why the error causes no reading (e.g., 'diode is reverse biased').
Things to Be Careful About
- The mark scheme accepts 'diode / power supply / ammeter connected the wrong way around' or 'voltmeter connected in series'. Provide one clear, physically sound reason.
A student investigates the rate of cooling of hot water in a test-tube under different conditions.
The student:
- arranges a test-tube as shown in Fig. 2.1
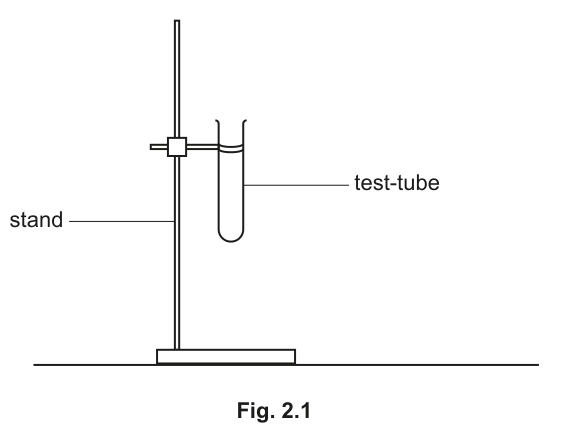
- pours 200 of cold water into a beaker
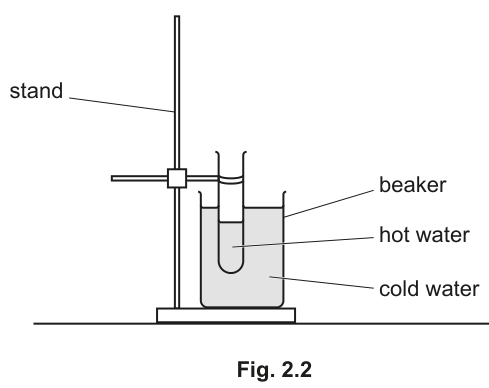
- pours hot water into the test-tube until it is approximately one-third full
- lowers the test-tube into the beaker of cold water until the level of the hot water in the test-tube is below the level of the cold water in the beaker as shown in Fig. 2.2
- places a thermometer into the test-tube
- waits for approximately 30 s before measuring the temperature and starting a stop-watch.
The student measures the temperature of the hot water in the test-tube.
The thermometer reading is shown in Fig. 2.3
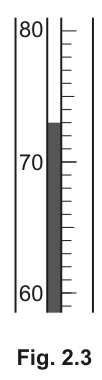
Read the thermometer and record the temperature in Table 2.1 at time .
Table 2.1
| time / ______ | test-tube cooling in cold water temperature / ______ | test-tube cooling in warm water temperature / ______ |
|---|---|---|
| 0 | 75 | |
| 54 | 68 | |
| 45 | 63 | |
| 41 | 58 | |
| 38 | 55 | |
| 36 | 35 | |
| 34 | 52 |
Answer
73
73
Walkthrough
The thermometer scale runs from 60 to 80 with major markings every 10 units and 10 minor divisions between them, meaning each small division represents 1 °C. The top of the liquid column is 3 small divisions above the 70 mark, giving a reading of 73 °C. Since the scale has 1 °C divisions, the reading is recorded to the nearest whole number.
Key Takeaways
Thermometers with 1 °C graduations are read to the nearest 1 °C. Always count the minor divisions from the nearest major marking.
Common Mistakes
Reading the scale from the wrong end (e.g. counting down from 80) or miscounting the minor divisions. Forgetting to include the unit if the table heading does not already specify it (though here the heading requires the unit to be added in part b(i)).
Things to Be Careful About
Ensure you are reading at eye level to avoid parallax error. The mark scheme accepts 73 or 73.0; since the smallest division is 1 °C, 73 is the correct precision.
The student measures the temperature of the hot water every 30 s for a further 180 s. The readings are shown in Table 2.1.
Answer
time / s
temperature / °C (both columns)
s, °C, °C
Walkthrough
The table records time and temperature. The standard unit for time in cooling experiments is seconds (s), and the temperature is given in degrees Celsius (°C) as indicated by the thermometer reading in part (a). Both column headings must include these units.
Key Takeaways
Table headings must always include the physical quantity and its unit separated by a slash (e.g., time / s).
Common Mistakes
Writing 'seconds' instead of 's', or 'Celsius' instead of '°C'. Forgetting to add units to both columns.
Things to Be Careful About
Ensure the units match the values recorded in the table. Time is in whole seconds, temperature is in whole degrees Celsius.
Answer
30, 60, 90, 120, 150, 180
30, 60, 90, 120, 150, 180
Walkthrough
The student measures the temperature every 30 s for a further 180 s, starting from . The subsequent time values are , , and so on, up to . These six values fill the remaining rows in the time column.
Key Takeaways
When filling a time column for regular intervals, simply add the interval to the previous value.
Common Mistakes
Starting the sequence at 1 instead of 30, or missing the final value of 180.
Things to Be Careful About
Ensure there are exactly six values to match the six empty cells in the table below the row.
Describe in detail one precaution that the student must take to make sure that the temperature measurements are as accurate as possible.
______
Answer
Read the thermometer scale at eye level (or right angles to the scale) to avoid parallax error.
Read the thermometer at eye level
Walkthrough
To get an accurate temperature reading, the observer's eye must be level with the top of the liquid column in the thermometer. Looking from above or below causes parallax error, making the reading appear higher or lower than it actually is. Other acceptable precautions include stirring the water before reading to ensure a uniform temperature, or ensuring the thermometer bulb is fully immersed but not touching the glass sides or base of the test-tube.
Key Takeaways
Parallax error is a common source of inaccuracy in reading scales. Always read at eye level.
Common Mistakes
Saying 'be more careful' or 'use a better thermometer'. The mark scheme requires a specific technique like reading at eye level or stirring.
Things to Be Careful About
The question asks for one precaution. Giving multiple is fine, but only one needs to be correct and detailed. 'Eye level' is the most direct answer for thermometer reading accuracy.
The student repeats the procedure in (a) and (b) but with 200 of warm water instead of cold water in the beaker as shown in Fig. 2.4.
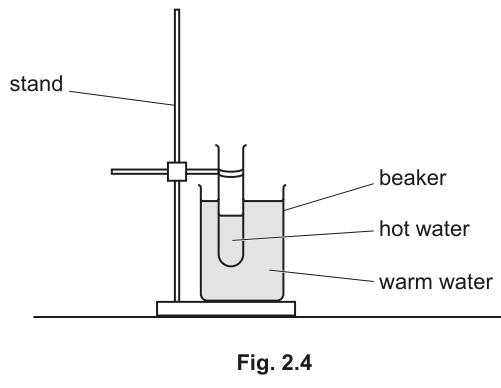
The student's readings with warm water are shown in Table 2.1.
One of the student's readings for warm water recorded in Table 2.1 is anomalous.
Identify the anomalous temperature reading and explain how you decided that the reading is anomalous.
anomalous reading ______
explanation ______
Answer
anomalous reading: 35 °C (at s)
explanation: It does not follow the trend; the reading is much lower than the preceding and following readings (which are decreasing gradually, but this one drops sharply and then increases).
Working
Warm water column: 75, 68, 63, 58, 55, 35, 52.
The temperature decreases steadily from 75 to 55 over the first 150 s. The next reading should be around 50–52 °C, but it is 35 °C. The following reading is 52 °C, which fits the trend. Thus, 35 is anomalous.
35; it does not follow the trend / is much lower than surrounding readings
Walkthrough
Look at the 'test-tube cooling in warm water' column: 75, 68, 63, 58, 55, 35, 52. The temperature is dropping steadily. From 75 to 55, the drops are 7, 5, 5, 3 degrees. The next drop should be small, but it drops by 20 degrees to 35, then rises to 52. This 35 °C reading breaks the pattern and is therefore anomalous.
Key Takeaways
An anomalous result is one that does not fit the general trend or pattern of the data. It is often identified by comparing a reading to its neighbours.
Common Mistakes
Identifying 52 as anomalous because it is higher than 35. The anomaly is the 35, as it is the value that disrupts the smooth cooling curve.
Things to Be Careful About
Always explain why it is anomalous by referencing the trend (e.g., 'it does not follow the pattern' or 'it is much lower than expected').
Use the temperature readings in Table 2.1 to calculate the temperature decrease of the hot water in the test-tube after cooling for 180 s in both the beaker of cold water and the beaker of warm water.
temperature decrease when cooling in the cold water = ______
temperature decrease when cooling in the hot water = ______
Working
Cold water:
Initial temperature () = 73 °C
Final temperature () = 34 °C
Decrease = °C
Warm water:
Initial temperature () = 75 °C
Final temperature () = 52 °C (using the non-anomalous value)
Decrease = °C
Answer
temperature decrease when cooling in the cold water = 39 °C
temperature decrease when cooling in the warm water = 23 °C
39 °C, 23 °C
Walkthrough
The question asks for the temperature decrease after 180 s. This is the initial temperature at minus the final temperature at .
For cold water: °C.
For warm water: °C. (Note: we use 52, not 35, because 35 is the anomalous reading identified in part (d)(i)).
Key Takeaways
When calculating a change, always use the initial and final values. Discard anomalous results before using them in calculations.
Common Mistakes
Using the anomalous reading (35) for the warm water calculation, giving °C. Forgetting the unit °C.
Things to Be Careful About
Ensure you use the correct initial temperatures for each column (73 for cold water, 75 for warm water).
Use your answers to (d)(ii) to decide how the temperature of the water in the beaker affects the rate of cooling of hot water in the test-tube.
State your conclusion.
______
Answer
The rate of cooling is greater (or the temperature decrease is larger) when the water in the beaker is cold.
This is because there is a larger temperature difference between the hot water in the test-tube and the cold water in the beaker compared to the warm water in the beaker.
Rate of cooling is greater in cold water due to larger temperature difference
Walkthrough
In part (d)(ii), the temperature decrease in cold water was 39 °C, while in warm water it was 23 °C over the same time (180 s). This means the hot water cooled faster in the cold water. Newton's Law of Cooling (qualitatively) states that the rate of heat loss is proportional to the temperature difference between the object and its surroundings. A larger temperature difference (hot water vs cold water) leads to a faster rate of cooling.
Key Takeaways
A larger temperature difference between an object and its surroundings results in a faster rate of cooling.
Common Mistakes
Saying 'cold water cools it faster' without mentioning the temperature difference. The conclusion must link the observation (larger decrease) to the cause (temperature difference).
Things to Be Careful About
The question asks how the temperature of the water in the beaker affects the rate. State the effect clearly: 'greater temperature difference leads to greater rate of cooling'.
Suggest one improvement to the experimental procedure described in (a) and (b) that allows a more valid comparison to be made between the two rates of cooling.
______
Answer
Use the same initial temperature for the hot water in the test-tube in both experiments.
Alternatively: Add equal volumes of hot water to the test-tube in both cases, or carry out both experiments at the same time.
Use the same initial temperature for the hot water
Walkthrough
To make a valid comparison of the cooling rates, the initial conditions of the hot water must be identical. In the data, the initial temperature was 73 °C for cold water and 75 °C for warm water. These are slightly different, which could affect the result. To improve the experiment, the student should ensure the hot water starts at exactly the same temperature in both runs. Other valid improvements include using a measuring cylinder to ensure exactly 200 cm³ of water is used in the test-tube each time, or lagging the beaker to reduce heat loss to the room.
Key Takeaways
In a comparative experiment, all variables except the independent variable (beaker water temperature) must be controlled.
Common Mistakes
Suggesting 'use a better thermometer' or 'do it again'. The improvement must specifically address the validity of the comparison between the two setups.
Things to Be Careful About
The improvement must be practical and directly related to controlling variables. 'Same initial temperature' is the most direct improvement given the data provided.
A student investigates the balancing of a metre rule which has a load of mass fixed to it at the 5.0 cm mark.
The student:
- places a pivot under the 50.0 cm mark of the rule
- places another load of mass on the rule
- adjusts the position of the load with mass until the rule is as close to balanced as possible as shown in Fig. 3.1.
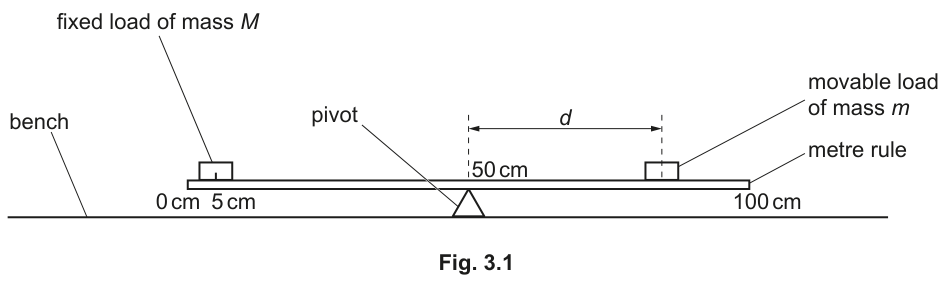
Fig. 3.2 shows the position of the 50 g mass when the rule is balanced.
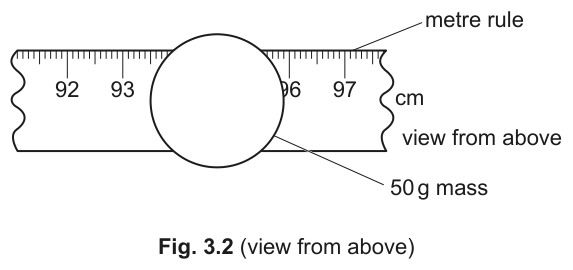
Take readings from the rule and use them to determine the position of the centre of the 50 g mass on the rule.
position of the centre of the 50 g mass = ______
Answer
Left edge = 93.5 cm
Right edge = 95.9 cm
Position of centre = = 94.7 cm
position of the centre of the 50 g mass = 94.7 cm
94.7
Walkthrough
The question asks for the position of the centre of the 50 g mass. Fig. 3.2 shows a view from above of the metre rule scale from 92 cm to 97 cm. The circular mass is placed on the rule. To find the centre, we read the positions of the left and right edges of the mass on the scale.
Looking at Fig. 3.2:
- The left edge of the mass aligns with 93.5 cm.
- The right edge of the mass aligns with 95.9 cm.
The centre is the midpoint between these two edges:
Key Takeaways
When measuring the position of an object on a scale, read the edges and find the midpoint. Always record readings to the precision the scale allows (here, 0.1 cm).
Common Mistakes
- Reading only one edge instead of both.
- Not averaging the two edges to find the centre.
- Forgetting the unit (cm).
Things to Be Careful About
- Read the scale carefully. The markings are in cm, with 10 small divisions between each cm, so each small division is 0.1 cm.
- Ensure the readings are taken at eye level to avoid parallax error, though this is a printed figure so we just read the values directly.
Calculate the distance from the centre of the 50 g mass to the 50.0 cm mark on the rule.
Record your answer on the answer line and in Table 3.1 on page 12.
= ______
Working
The pivot is at the 50.0 cm mark.
The centre of the 50 g mass is at 94.7 cm.
= 44.7 cm
44.7
Walkthrough
The distance is the distance from the centre of the 50 g mass to the pivot. The pivot is at the 50.0 cm mark, and the centre of the mass is at 94.7 cm.
Key Takeaways
Distance is the difference between two positions on a scale.
Common Mistakes
- Subtracting in the wrong order (though distance is always positive, so it doesn't matter here, it's good practice).
- Forgetting the unit.
Things to Be Careful About
- Ensure both positions are read from the same scale and in the same units.
Calculate the value of .
Record your answer on the answer line and in Table 3.1 on page 12.
= ______
Working
Rounding to 3 significant figures:
= 22.4
22.4
Walkthrough
The question asks to calculate where cm.
The mark scheme requires the value in the table to be given to 3 significant figures. So we round 22.3714 to 22.4.
Key Takeaways
When recording calculated values in tables, follow the significant figures rule indicated by the scheme or the data. Here, 3 s.f. is required.
Common Mistakes
- Not rounding to the correct number of significant figures.
- Forgetting the unit .
Things to Be Careful About
- The unit is , not cm. Ensure the answer line includes the unit if required, though the blank already has the unit next to it.
It is difficult to balance the rule exactly.
Describe a technique that the student uses to make sure that the value of is as accurate as possible.
______
Answer
Adjust the mass slowly until the rule just tilts one way, then adjust it again until it just tilts the other way. The true balance point is between these two positions.
Adjust mass slowly until rule tilts one way, adjust again until it just tilts the other way
Walkthrough
Balancing a rule exactly is difficult because it's hard to tell when it's perfectly horizontal. A common technique to improve accuracy is to find the two points where the rule just starts to tilt in opposite directions and take the midpoint.
By adjusting the mass slowly, you can find:
- The position where the rule just begins to tilt to the left.
- The position where the rule just begins to tilt to the right.
The actual balance point lies between these two positions. This reduces the uncertainty in the position of the mass.
Key Takeaways
In balancing experiments, finding the range of positions where the object is 'almost' balanced and taking the midpoint improves accuracy.
Common Mistakes
- Saying 'be more careful' or 'use better apparatus'. These are vague and do not score.
- Not describing the technique of finding the tilt points.
Things to Be Careful About
- The answer must be a specific technique, not a general statement about accuracy.
The student repeats the procedure in (a) for values of mass from 60 g to 100 g and records all the readings in Table 3.1.
Table 3.1
| mass / | distance / | / |
|---|---|---|
| 50 | ||
| 60 | 37.7 | 26.5 |
| 70 | 32.3 | 31.0 |
| 80 | 28.2 | 35.5 |
| 90 | 25.3 | 39.5 |
| 100 | 22.2 | 45.0 |
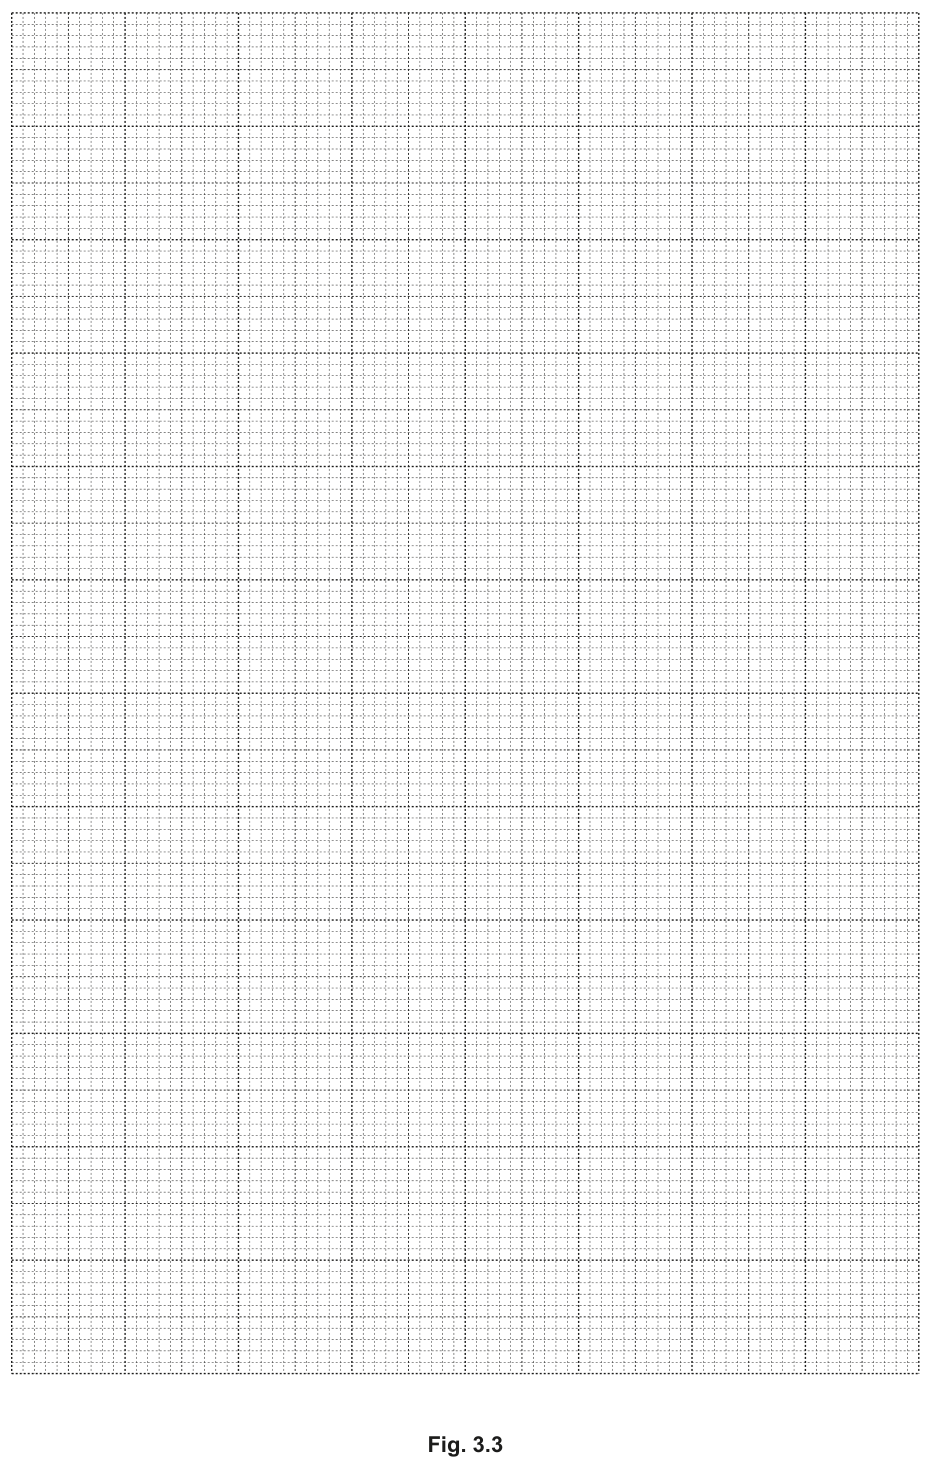
On the grid provided in Fig. 3.3 on page 13, plot a graph of on the -axis against on the -axis. The axes do not need to start from the origin (0, 0).
Draw the straight line of best fit.
Answer
Graph details:
- x-axis: / , range from 20 to 46, with major divisions every 5 units.
- y-axis: / g, range from 45 to 105, with major divisions every 10 g.
- Points plotted:
- (22.4, 50)
- (26.5, 60)
- (31.0, 70)
- (35.5, 80)
- (39.5, 90)
- (45.0, 100)
- Line of best fit: A thin straight line passing as close as possible to all points, with roughly equal numbers of points on either side.
See diagram for plotted graph and line of best fit
Walkthrough
The question asks to plot a graph of on the y-axis against on the x-axis.
1. Axis labelling and scaling:
- x-axis: Label as ' / '. The values range from 22.4 to 45.0. A suitable scale is 20 to 46, with major divisions every 5 units (20, 25, 30, 35, 40, 45).
- y-axis: Label as ' / g'. The values range from 50 to 100. A suitable scale is 45 to 105, with major divisions every 10 g (50, 60, 70, 80, 90, 100).
2. Plotting points:
Plot the following coordinates :
- (22.4, 50)
- (26.5, 60)
- (31.0, 70)
- (35.5, 80)
- (39.5, 90)
- (45.0, 100)
Points must be plotted accurately, to the nearest half small square.
3. Line of best fit:
Draw a thin, straight line of best fit. The line should pass through or as close as possible to all points, with roughly equal numbers of points on either side of the line. Do not force the line through the origin unless the data suggests it (here, it doesn't need to, as the axes don't start at 0,0).
Key Takeaways
When plotting graphs:
- Always label axes with quantity and unit.
- Use linear scales that are not awkward (avoid thirds or sevenths).
- Plot points accurately.
- Draw a thin line of best fit, not a 'connect-the-dots' line.
Common Mistakes
- Forgetting to label the axes with units.
- Using an awkward scale that doesn't use at least half the grid.
- Plotting points inaccurately (more than half a small square off).
- Drawing a zigzag line connecting the points instead of a line of best fit.
Things to Be Careful About
- The x-axis values are , not . Ensure you use the correct column from the table.
- The y-axis is , not .
- Use a sharp pencil for plotting points and drawing the line.
Calculate the gradient of your line. Show all working and indicate on the graph the values you use.
= ______
Working
To find the gradient , choose two points on the line of best fit that are far apart. For example, using the points (22.4, 50) and (45.0, 100):
Indicate these values on the graph by drawing a large right-angled triangle on the line of best fit and showing the read-offs.
= 2.2
2.2
Walkthrough
The gradient is the change in divided by the change in for the line of best fit.
Choose two points on the line of best fit. It is best to use points that are far apart to minimize reading errors. For example, using the endpoints of the data:
- Point 1: ,
- Point 2: ,
The mark scheme accepts values between 2.0 and 2.4. We can round to 2.2.
On the graph, you must indicate the values used by drawing a large triangle on the line of best fit and showing the read-offs and the corresponding .
Key Takeaways
When calculating the gradient of a line of best fit, always use two points ON THE LINE, not necessarily the data points. Use a large triangle to minimize percentage error.
Common Mistakes
- Using data points instead of points on the line of best fit.
- Using a triangle that is too small, leading to large reading errors.
- Not showing the read-offs on the graph.
Things to Be Careful About
- The gradient is , which is . Ensure you don't invert this.
- Show the triangle on the graph with clearly marked read-offs.
The mass of the load fixed to the rule can be determined using the equation:
Use your value of from (d)(i) to calculate the mass of the load fixed to the rule.
= ______
Working
Given the equation:
Using :
Rounding to 3 significant figures:
= 49 g
49
Walkthrough
The question gives the equation and asks to calculate using the gradient found in part (d)(i).
Using :
Rounding to a sensible number of significant figures (3 s.f. based on the data):
Key Takeaways
Always use the value you calculated in the previous part, even if it's slightly different from the 'true' value. Error carried forward is accepted.
Common Mistakes
- Using the wrong value of .
- Forgetting the unit (g).
Things to Be Careful About
- The equation is given, so no need to derive it. Just substitute and calculate.
Suggest why this method of determining the mass of the fixed load is unsuitable if a movable load of mass is used.
______
Answer
If g, the required distance would be greater than 50 cm. This means the balance point would be beyond the end of the metre rule, making it impossible to balance.
Alternatively: The rule would not balance because the moment of the 40 g mass would be too small to balance the fixed load within the length of the rule.
Impossible to balance the rule / balance point is beyond the end of the rule
Walkthrough
The method relies on balancing the moment of the fixed load (at 5 cm from the 50 cm pivot, so distance 45 cm) with the moment of the movable load (at distance from the pivot).
Moment of =
Moment of =
For balance:
From the graph, , so .
If g:
The pivot is at 50 cm. If cm, the mass would need to be placed at cm. But the metre rule only goes up to 100 cm. Therefore, the balance point is beyond the end of the rule, and it is impossible to balance the rule with a 40 g mass.
Key Takeaways
When evaluating an experiment, consider the physical limits of the apparatus. If a calculation gives a value outside the range of the apparatus, the method is unsuitable.
Common Mistakes
- Saying 'the mass is too small' without explaining why this is a problem.
- Not mentioning that the balance point would be beyond the end of the rule.
Things to Be Careful About
- The explanation must link the mass value to the physical constraint of the metre rule (100 cm length).
A student has a converging (convex) lens and needs to determine its focal length.
Plan an experiment that will enable the student to measure an accurate value for the focal length of the lens.
The focal length of a lens can be calculated using the equation:
where is the distance between an object and the lens and is the distance between the focussed image of the object and the lens.
Fig. 4.1 shows some of the apparatus available.
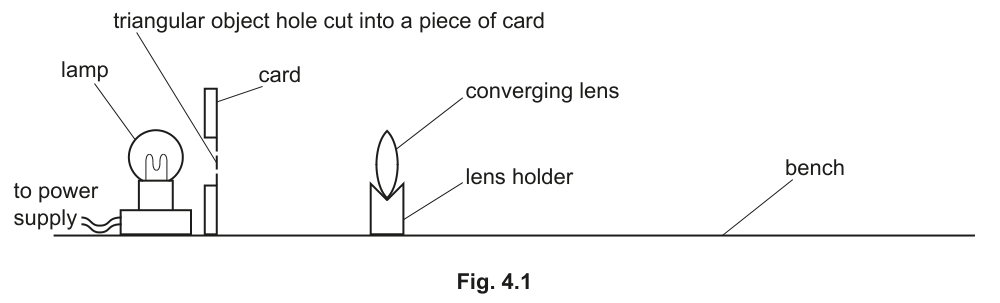
The lamp is connected to a power supply and can be switched on and off as required.
Write a plan for the experiment.
In your plan you should:
- list any additional apparatus needed
- draw a diagram of the arrangement of the apparatus, labelling and
- explain briefly how to do the experiment
- state the steps taken to obtain a sharp, focussed image
- explain how to use your readings to determine .
Answer
Additional apparatus: metre rule (or measuring tape) and a screen (or white paper/card on a stand).
Method:
- Arrange the lamp, card with the triangular object hole, converging lens, and screen in a straight line on the bench. Switch on the lamp.
- Move the lens (or screen) forwards and backwards slowly to obtain a sharp, focused image of the triangle on the screen. Ensure all components are at the same height above the bench. (Carrying out the experiment in a darkened room helps).
- Measure and record the object distance (distance from the object to the lens) and the image distance (distance from the lens to the screen) using the metre rule. Repeat for several different values of .
Determination of :
- Substitute the measured values of and into the given equation to calculate for each pair of readings.
- Find the average value of from the repeated calculations to determine the final focal length.
Plan includes: additional apparatus (metre rule and screen), labelled diagram showing u and v, method to move lens/screen to focus image, steps for sharp image (slow adjustment, same height, dark room), and calculation using f = uv/(u+v) with repetition for an average.
Walkthrough
- Additional apparatus: The question provides a lamp, an object (card with a hole), a lens, and a bench. To measure , the real image formed by the converging lens must be projected onto a surface. Therefore, a screen (or white paper/card) is required. To measure the distances and , a length-measuring device is needed, so a metre rule (or measuring tape) is required. This earns 1 mark.
- Diagram: The standard arrangement for this experiment is a straight line along the optical bench: lamp → object (card) → converging lens → screen. The diagram must clearly show all these components. The distance is labelled between the object and the lens, and is labelled between the lens and the screen. This earns 1 mark.
- Method: The candidate must describe aligning the components, switching on the light, and the core action of adjusting the setup. Moving the lens or screen changes the image distance to match the object distance, allowing a real image to form on the screen. Once formed, and are measured and recorded. Repeating for different values is good practice. This earns 2 marks.
- Steps for a sharp image: To earn this mark, the candidate must provide specific technical details rather than just "adjust until clear". Good answers include: moving the screen/lens slowly or forwards and backwards to fine-tune focus; ensuring the object, lens, and screen are at the same height above the bench to keep the image centred; and working in a darkened room so the projected image has better contrast. This earns 1 mark.
- Determination of : The mark scheme gives two acceptable routes for this 1 mark: either explicitly state that the measured and values are substituted into the given equation , or state that the experiment is repeated for different values of and an average is calculated. Both demonstrate understanding of how to process the data. This earns 1 mark.
Key Takeaways
- Planning an optics experiment to find focal length requires identifying the necessary additional apparatus (a screen to capture a real image, a ruler for distances).
- A clear diagram with correctly labelled distances ( and measured from the optical centre of the lens) is essential for full credit.
- Technique for finding a sharp image involves fine adjustments (moving slowly), alignment (same height), and controlling ambient light (darkened room).
- Repeating measurements for different object distances and averaging the calculated focal lengths reduces random errors and improves accuracy.
Common Mistakes
- Forgetting to include a screen to project the real image onto; without it, cannot be measured.
- Not labelling and correctly in the diagram (e.g., measuring from the ends of the bench or the holders instead of the optical centre of the lens and the object itself).
- Writing "measure the focal length" without explaining how the calculation from and is performed using the provided equation.
- Vague descriptions for obtaining a sharp image, such as "adjust it until it is clear", which lack the specific technical steps (slow movement, alignment, dark room) required for the mark.
- Not mentioning repeating the experiment for multiple values of to find an average, which is a key part of determining an accurate value.
Things to Be Careful About
- The diagram must show the screen; without it, a real image cannot be captured and cannot be measured.
- is the distance from the object (card) to the lens, and is the distance from the lens to the screen. Ensure these are clearly indicated with arrows and labels in the diagram.
- When describing how to find a sharp image, specify moving the components slowly and ensuring they are at the same height; vague answers like "adjust until it is clear" may not score.
- The equation is given in the question; candidates must explicitly state substituting their readings into it or repeating to find an average. Simply stating "use the equation" without mentioning substitution or repetition may lose the mark.