Physics 5054/41 — May/June 2024
Cambridge O-Level · Alternative to Practical · worked solutions for every part, with the mark scheme
Topics Experimental Contexts · Analysis, Conclusions and Evaluation · Observations and Measurements · Planning Experiments and Investigations
A student finds the volume of a small glass ball (marble) by two different methods.
method 1
The student:
- places six small glass balls by the side of a metre rule as shown in Fig. 1.1
- makes sure that there are no gaps between the balls.
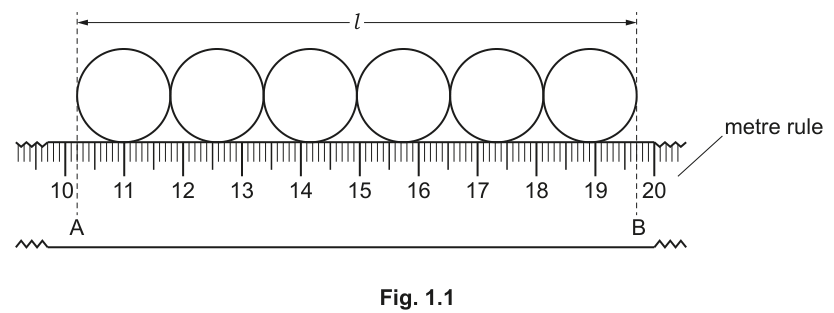
Take readings on the metre rule of the positions of points A and B shown in Fig. 1.1.
Give your readings to the nearest .
position of point A = ______
position of point B = ______
Answer
position of point A = 10.2 cm
position of point B = 19.7 cm
10.2 cm and 19.7 cm
Walkthrough
The metre rule is graduated in millimetres, meaning each small division represents . Point A aligns with the second small division past , giving . Point B aligns with the seventh small division past , giving . Readings must be given to the nearest as requested.
Key Takeaways
When reading a scale, identify the value of each smallest division. Always read to the precision demanded by the question, including a trailing zero if the scale justifies it (e.g. not ).
Common Mistakes
Reading the scale from the wrong end, or failing to read to the required precision (e.g. reading instead of ).
Things to Be Careful About
Ensure you are reading the correct edge of the object. The question specifies points A and B, which are the outer edges of the first and sixth balls respectively. The mark scheme accepts values close to these if drawn correctly, but the printed figure clearly shows and .
The length on Fig. 1.1 is the distance between points A and B.
The average diameter of one ball can be found using the equation:
Use your answers to (a)(i) to calculate the length and diameter . Give your answers to the nearest .
= ______
= ______
Working
Answer
= 9.5 cm
d = 1.6 cm
9.5 cm and 1.6 cm
Walkthrough
The length is the distance between points A and B. Subtract the reading at A from the reading at B: . Since six identical balls are lined up touching, the total length is six times the diameter of one ball (). Rearranging gives . The question asks for the answer to the nearest , so round to .
Key Takeaways
When finding a derived quantity from a measurement of multiple identical objects, divide the total measurement by the number of objects. Always round to the required precision at the end.
Common Mistakes
Forgetting to subtract the initial reading from the final reading to find . Rounding intermediate results too early (e.g. using before dividing, though here is better).
Things to Be Careful About
The question explicitly asks for answers to the nearest . rounds to , not . Both and must be given to this precision.
The average volume of one glass ball using this method, is given by the equation:
Calculate .
= ______
Working
Answer
V = 2.1 cm^3
2.1 cm^3
Walkthrough
The formula for the volume of a sphere in terms of diameter is . The question provides . Substitute : . Calculate . Then . Divide by 6 to get . Rounding to a sensible number of significant figures (or matching the precision of the inputs) gives .
Key Takeaways
When using a formula with a given constant like , use that exact value. Be careful with the order of operations: cube the diameter before multiplying and dividing.
Common Mistakes
Using the radius instead of the diameter in the formula, or calculating and then cubing the result. Forgetting to cube the diameter entirely.
Things to Be Careful About
The mark scheme accepts or . is appropriate given the diameter was given to 2 significant figures ().
method 2
- The student pours water into a measuring cylinder.
The volume of water in the measuring cylinder is shown in Fig. 1.2.
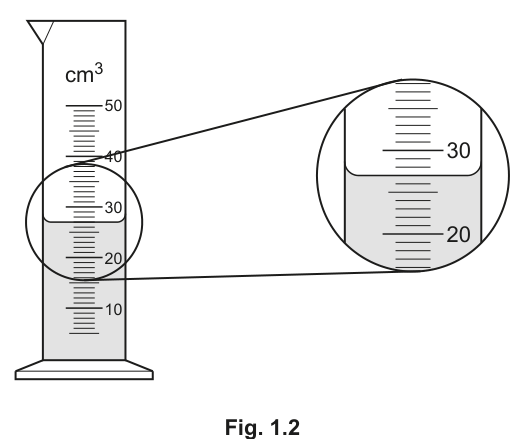
Write down the reading .
= ______
Answer
V1 = 27.0 cm^3
27.0 cm^3
Walkthrough
The measuring cylinder has major markings at . Between and , there are 10 small divisions, so each division represents . The liquid forms a meniscus (a curve at the surface). The correct reading is taken at the bottom of the meniscus. In Fig. 1.2, the bottom of the meniscus is 3 divisions below , which is . Since the scale is in divisions, we can estimate to the nearest or , but is a safe and accurate reading.
Key Takeaways
Always read the bottom of the meniscus for clear liquids like water. Identify the value of each smallest division on the scale.
Common Mistakes
Reading the top of the meniscus, or reading from the top of the scale markings instead of the bottom of the curve.
Things to Be Careful About
The mark scheme accepts or . Writing shows you are aware of the scale precision.
- The six glass balls are carefully added to the water in the measuring cylinder.
The new reading on the measuring cylinder is shown in Fig. 1.3.
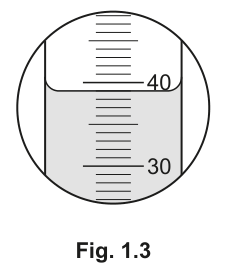
The volume of the six balls is given by
Calculate . Show your working.
= ______
Working
From Fig. 1.3, the new reading is .
Answer
VT = 12.0 cm^3
12.0 cm^3
Walkthrough
In Fig. 1.3, the scale is shown between and . The bottom of the meniscus is 1 division below , which is . The volume of the six balls is the difference between the final volume and the initial volume: .
Key Takeaways
The volume of an irregular solid can be found by water displacement. The increase in the liquid level equals the volume of the solid submerged.
Common Mistakes
Forgetting to subtract the initial volume and just writing down . Reading the meniscus incorrectly.
Things to Be Careful About
Ensure both readings are taken at the bottom of the meniscus. The mark scheme specifically looks for the value of and the correct subtraction.
Calculate the average volume of one ball using this method. Give your answer to the nearest .
= ______
Working
Answer
V = 2.0 cm^3
2.0 cm^3
Walkthrough
The total volume of the six balls is . To find the average volume of one ball, divide by 6: . The question asks for the answer to the nearest , so is the correct format.
Key Takeaways
When finding an average from a total measurement of multiple identical objects, divide the total by the number of objects.
Common Mistakes
Dividing by 3 instead of 6, or forgetting to include the decimal place to show precision.
Things to Be Careful About
The mark scheme accepts values correct from the candidate's answer to (b)(ii), so if they got , they should get .
Suggest whether method 1 or method 2 gives the more accurate value for the volume of the ball.
Explain your answer.
method giving more accurate value ______
explanation ______
Answer
method giving more accurate value: method 1
explanation: The measuring cylinder can only measure to the nearest (or ), whereas measuring the diameter with a metre rule to the nearest is more accurate.
Method 1 is more accurate because the measuring cylinder has a lower precision (larger division size) than the metre rule used to measure the diameter.
Walkthrough
Method 1 uses a metre rule to measure the total length of six balls. The rule is graduated to (), allowing a precise measurement of the diameter. Method 2 uses a measuring cylinder. The scale in Fig. 1.2 and 1.3 shows divisions of . The volume of water is read to the nearest (or perhaps with estimation). A difference of from a reading of to means the uncertainty is relatively large (around ). Measuring the diameter to gives a much smaller relative uncertainty. Therefore, method 1 is more accurate.
Key Takeaways
Accuracy depends on the precision of the apparatus. A smaller division size on a measuring instrument generally leads to more accurate results.
Common Mistakes
Saying method 2 is more accurate because it measures volume directly. While it measures volume directly, the precision of the measuring cylinder is poor, making the result less accurate. Saying "method 1 is better because it is faster" is not a valid physics reason.
Things to Be Careful About
The mark scheme specifically mentions the limitation of the measuring cylinder ( or precision) or the accuracy of measuring the diameter to the nearest mm. Ensure your explanation links the apparatus limitation to the accuracy of the final volume.
The student now uses the six glass balls to find the average mass of one glass ball using a small beaker and a top pan (electronic) balance.
Describe the method the student uses.
Answer
- Place the empty beaker on the top pan balance and tare it (set to zero).
- Add the six glass balls to the beaker.
- Read the total mass of the six balls from the balance.
- Divide the total mass by 6 to find the average mass of one ball.
(Alternatively: Record the mass of the empty beaker, add the six balls, record the new total mass, subtract the empty beaker mass, and divide by 6.)
Place the beaker on the balance and tare it (or record its mass). Add the six balls, read the total mass, and divide by 6.
Walkthrough
To find the average mass of one ball, you need the total mass of all six balls. Since the balls are small, their individual masses might be too small to measure accurately on a top pan balance, or the balance might not have enough precision. By measuring six together, you get a larger, more readable mass. You must account for the mass of the beaker. The best method is to place the beaker on the balance and use the 'tare' function to reset the display to zero. Then add the six balls and read the mass directly. Finally, divide by 6. If the balance does not have a tare function, you record the mass of the empty beaker, add the balls, record the new mass, subtract the beaker's mass, and divide by 6.
Key Takeaways
When measuring the mass of small objects, measure multiple at once to improve precision and readability. Always account for the container's mass by taring or subtracting.
Common Mistakes
Forgetting to mention taring or subtracting the beaker's mass. Measuring the mass of just one ball (which might be below the balance's precision). Not dividing by 6 at the end.
Things to Be Careful About
The mark scheme awards one mark for the beaker on balance and tare/record, and one mark for adding 6 balls, finding total mass, and dividing by 6. Ensure both steps are clearly described in your method.
A student investigates how the temperature of the surroundings affects the rate of cooling of water.
The student:
- pours of hot water into a beaker
- uses a thermometer to take the temperature of the water at time .
The thermometer reading at time is shown in Fig. 2.1.
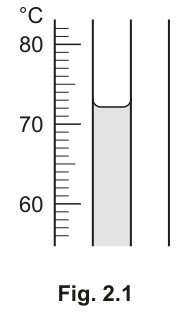
Record the temperature of the water at time in Table 2.1.
Table 2.1
| 0 | ______ |
| 30 | 69 |
| 60 | 67 |
| 90 | 66 |
| 120 | 65 |
| 150 | 64 |
| 180 | 63 |
| 210 | 62 |
| 240 | 61 |
Answer
72
72
Walkthrough
The thermometer scale runs from 60 °C to 80 °C with major marks every 10 °C and minor marks every 1 °C. The liquid column rests two small divisions above the 70 °C mark, giving a reading of 72 °C. This value is recorded in the first row of Table 2.1.
Key Takeaways
When reading a thermometer, identify the value of each small division and count up from the nearest marked major division. Always include the unit when recording the reading.
Common Mistakes
Reading the scale from the wrong end or miscounting the small divisions. Forgetting to include the unit °C in the table.
Things to Be Careful About
Read to the precision of the instrument. The scale has 1 °C divisions, so the reading is to the nearest 1 °C. The mark scheme accepts 72 °C; note that the image description may suggest 73 °C but the calculation in part (iii) relies on 72 °C to produce the expected cooling rate of 0.067 °C/s.
The student then records the temperature of the water every for . The results are recorded in Table 2.1.
Before taking each temperature reading, the student carefully stirs the water in the beaker. Explain why.
Answer
To ensure an even temperature throughout the water so that the thermometer reads the average temperature of the water, not a localised hot or cold spot.
to ensure an even temperature throughout the water
Walkthrough
Water in a beaker cools from the surface and sides, creating temperature gradients. Stirring promotes convection and mixes the water, ensuring the temperature is uniform throughout the beaker. The thermometer then measures the true average temperature of the water.
Key Takeaways
Stirring eliminates localised temperature variations and ensures the thermometer reading represents the bulk temperature of the liquid.
Common Mistakes
Saying "to cool the water faster" or "to mix the heat". The mark scheme specifically looks for the idea of an even or uniform temperature throughout.
Things to Be Careful About
Use precise language: "even temperature" or "uniform temperature" rather than vague terms like "mix it up". The mark scheme accepts equivalents like "heat is evenly spread" or "make sure temp is the same through the water/beaker".
Calculate the average cooling rate of the water for the first of the experiment. Use the readings in Table 2.1 and the equation:
where is the temperature of the water at , is the temperature at and is the time of .
Give the unit for .
= ______ unit ______
Working
Answer
= 0.067 unit °C/s
0.067 °C/s
Walkthrough
The formula for the average cooling rate is . From Table 2.1, °C and °C. The time interval is s. Substituting these values gives °C/s, which rounds to 0.067 °C/s to 2 significant figures. The unit is derived from the formula: temperature difference in °C divided by time in s, giving °C/s.
Key Takeaways
When calculating an average rate of change, use the total change in the quantity divided by the total time. The unit is the unit of the numerator divided by the unit of the denominator.
Common Mistakes
Using the wrong temperatures from the table (e.g., using instead of ). Forgetting to include the unit °C/s in the final answer, which carries a separate mark.
Things to Be Careful About
Use the reading from part (a)(i) (72 °C) as . The mark scheme awards a method mark for the correct calculation from candidate readings (accepting 0.067) and a separate mark for the unit °C/s. Give the answer to 2 or 3 significant figures as appropriate.
Calculate the average cooling rate of the water for the final of the experiment. Use the equation:
where is the temperature of the water at , is the temperature of the water at and is the time of .
= ______ unit ______
Working
Answer
= 0.033 unit °C/s
0.033 °C/s
Walkthrough
The formula is . From Table 2.1, °C and °C. The time interval is s. Substituting gives °C/s, which rounds to 0.033 °C/s.
Key Takeaways
The cooling rate decreases as the water cools. Calculating rates over different intervals shows this trend clearly.
Common Mistakes
Using the wrong time interval (e.g., using 240 s instead of 90 s for ). Forgetting to subtract the temperatures correctly.
Things to Be Careful About
The mark scheme accepts 0.03(333), so 0.033 or 0.0333 both score. The unit is not explicitly asked for here but is implied by the context.
Answer
is greater than . The rate of cooling is faster when the temperature difference between the water and the surroundings is larger. As the water cools, its temperature approaches room temperature, the temperature difference decreases, and the rate of heat loss slows down.
C1 is greater than C2 because the temperature difference between the water and the surroundings is larger at the start.
Walkthrough
The calculated values are °C/s and °C/s, so . This is expected because heat transfer by conduction, convection, and radiation is proportional to the temperature difference between the object and its surroundings. At the start of the experiment, the water is much hotter than the room, so heat is lost rapidly. As the water cools, the temperature difference shrinks, and the cooling rate decreases.
Key Takeaways
The rate of cooling is not constant; it depends on the temperature difference between the object and its surroundings. A larger difference means a faster rate of cooling.
Common Mistakes
Saying "the water cools down so it loses less heat" without mentioning the temperature difference. The mark scheme specifically looks for the link to the temperature approaching room temperature or the temperature difference decreasing.
Things to Be Careful About
The mark scheme accepts "less drop in temperature as the temperature approaches room temperature" or equivalents. Be clear that you are comparing the rates and explaining the physical reason.
The student repeats the procedure described in (a)(i) but this time he places the beaker inside a larger beaker containing iced water. The arrangement is shown in Fig. 2.2.
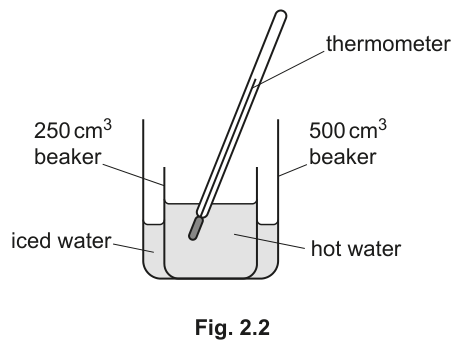
The student reads the temperature of the hot water, records the reading and immediately starts the stop-watch.
Table 2.2. shows the temperature at times , , , and .
Table 2.2
| 0 | 75 |
| 30 | 68 |
| 60 | 62 |
| 90 | 57 |
Calculate the average cooling rate of the hot water for the . Use the readings in Table 2.2 and the equation:
= ______ unit ______
Working
Answer
= 0.20 unit °C/s
0.20 °C/s
Walkthrough
The formula is . From Table 2.2, °C and °C. The time interval is s. Substituting gives °C/s.
Key Takeaways
Cooling in a colder environment (iced water) is much faster than cooling in room air.
Common Mistakes
Using the wrong temperatures from Table 2.2. Forgetting to include the unit.
Things to Be Careful About
The mark scheme accepts 0.20 (°C/s). The calculation is exact, so 0.2 or 0.20 both score.
Answer
is greater than . The iced water provides a colder environment than the room, so there is a larger temperature difference between the hot water and the surroundings. This results in a faster rate of heat transfer and a greater cooling rate.
C3 is greater than C1 because the surroundings are colder, resulting in a larger temperature difference and faster heat loss.
Walkthrough
°C/s is much greater than °C/s. The difference is due to the surroundings: in part (a), the beaker is in room air, while in part (b), it is surrounded by iced water. The larger temperature difference between the hot water and the iced water drives a faster rate of heat loss.
Key Takeaways
The rate of cooling depends on the temperature of the surroundings. A colder surroundings leads to a faster cooling rate.
Common Mistakes
Saying "the iced water cools the water faster" without explaining why. The mark scheme requires the link to the increased temperature difference or the colder surroundings.
Things to Be Careful About
The mark scheme accepts "more energy is lost to the colder surroundings", "iced water provides increased cooling effect", "lower temp of surroundings", or "heat transferred to iced water". State the comparison clearly first.
The recorded readings show that this experiment is not a valid comparison of and .
By referring to the results recorded in Table 2.1 and Table 2.2, explain why this is not a valid comparison.
Answer
The initial temperature of the water is different in the two experiments (72 °C in Table 2.1 and 75 °C in Table 2.2). Since the rate of cooling depends on the initial temperature difference to the surroundings, the experiments are not validly comparable unless they start at the same temperature.
The initial temperatures are different (72 °C and 75 °C), so the temperature difference to the surroundings is not the same.
Walkthrough
A valid comparison of cooling rates requires all variables to be controlled except the one being investigated (the surrounding temperature). Table 2.1 starts at 72 °C, while Table 2.2 starts at 75 °C. Because the initial temperatures differ, the initial temperature differences to the surroundings are different, making a direct comparison of and invalid.
Key Takeaways
When comparing rates or results, ensure that the initial conditions are identical. Any difference in initial values introduces a confounding variable.
Common Mistakes
Saying "the times are different" or "the tables have different numbers of readings". The key issue is the different starting temperatures.
Things to Be Careful About
The mark scheme specifically asks to refer to the results in the tables. Quote the actual temperatures (72 °C and 75 °C) to show you have read the data. The mark scheme accepts "different initial temperatures" as the key point.
Answer
The volume (or mass) of the hot water must be kept constant. Other acceptable answers include: the position of the thermometer in the water, or the room temperature (if not using iced water).
volume of (hot) water
Walkthrough
To make a fair comparison of cooling rates, all factors that could affect the rate of heat loss must be kept constant. The volume (or mass) of water determines the total heat capacity; a larger volume cools more slowly. The position of the thermometer must be the same to ensure it measures the same part of the water. The room temperature must be constant if comparing room-air cooling to iced-water cooling.
Key Takeaways
In any experiment, identify all variables that could affect the outcome and control them. Only change the independent variable (here, the surrounding temperature).
Common Mistakes
Saying "the same beaker" without specifying what property of the beaker matters (e.g., material, shape, volume). The mark scheme accepts volume of water, position of thermometer, or room temperature.
Things to Be Careful About
The mark scheme explicitly lists "volume of (hot) water", "position of thermometer in the water", and "room temperature". Any one of these scores. Do not suggest "same room temperature" if the experiment deliberately changes the surrounding temperature to iced water; instead, suggest keeping the volume or thermometer position constant.
A student measures the focal length of a lens.
Fig. 3.1 shows the apparatus she uses and the position of the lens when a clearly focused image is formed on the screen.
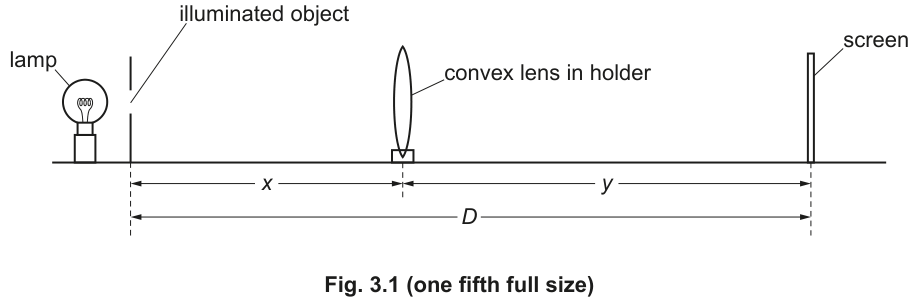
The student:
- places the screen a distance from the illuminated object
- places the lens between the object and the screen so that the lens is very close to the illuminated object
- moves the lens slowly away from the illuminated object until a clearly focused image is formed on the screen.
Answer
4.8 cm
Walkthrough
Using a millimeter ruler, measure the distance directly between the illuminated object and the centre of the convex lens holder shown in Fig. 3.1 on the examination paper. The distance measures (within the permitted tolerance of ).
Key Takeaways
- When taking ruler measurements on diagrams, align the mark accurately with the starting line and read to the nearest millimetre ().
Common Mistakes
- Measuring from the lamp instead of the illuminated object slit.
Things to Be Careful About
- Ensure the reading includes a single decimal place () representing measurement to the nearest millimetre.
Fig. 3.1 is drawn to a scale of one fifth full size.
Use your answer to (a)(i) to calculate the actual object distance from the lens.
= ______
Working
Answer
24.0 cm
Walkthrough
The diagram is drawn to a scale of one-fifth full size (). To find the actual object distance , multiply the measured diagram length by :
Key Takeaways
- To convert from a reduced-scale diagram ( full size) to the actual real-world length, multiply by .
Common Mistakes
- Dividing by 5 instead of multiplying.
Things to Be Careful About
- Retain appropriate precision consistent with the measurements (e.g. or ).
Deduce the image distance , the distance from the lens to the screen when a clear image is seen.
= ______
Working
Answer
36.0 cm
Walkthrough
The total distance between the illuminated object and the screen is . Since the lens is between the object and the screen, the total distance is the sum of the object distance and image distance ().
Therefore:
Key Takeaways
- The total separation between object and screen on an optical bench is .
Common Mistakes
- Forgetting that is given in the question stem.
Things to Be Careful About
- Maintain consistency in significant figures/decimal places ().
Fig. 3.2 shows the shape of the illuminated object and Fig. 3.3 shows the image seen on the screen.
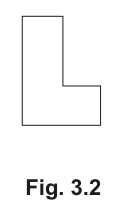
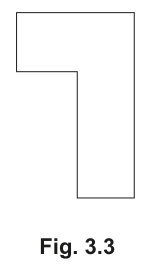
Describe two differences between the illuminated object and its image on the screen.
- ______
- ______
Answer
- Inverted (upside down)
- Magnified (larger than the illuminated object)
- Inverted / upside down
- Magnified / larger than illuminated object
Walkthrough
Comparing Fig. 3.2 (the upright L-shaped illuminated object) with Fig. 3.3 (the image formed on the screen):
- Orientation: The image is vertically inverted (upside down) and laterally inverted (left-to-right flipped).
- Size: The image dimensions are larger than those of the original object, meaning the image is magnified.
Any two valid differences (inverted/upside down, laterally inverted, magnified/larger) gain the 2 marks.
Key Takeaways
- Real images formed on a screen by a convex lens when (object placed between and ) are inverted and magnified.
Common Mistakes
- Stating that the image is "virtual" or "real" — the question asks for visible physical differences between the object and image, not the type of image.
Things to Be Careful About
- Give two distinctly different properties rather than two phrasings of the same property.
The student moves the screen away from the illuminated object and repeats the procedure for values of , , and .
Table 3.1 shows the values recorded.
Add your values for and from (a)(ii) and (a)(iii) to Table 3.1 on page 12.
Complete Table 3.1 by calculating the value of for each value of .
Give your answers to 3 significant figures.
Table 3.1
| 60.0 | |||
| 70.0 | 21.0 | 49.0 | |
| 80.0 | 19.5 | 60.5 | |
| 90.0 | 18.6 | 71.4 | |
| 100.0 | 17.8 | 82.2 |
Working
For :
Calculating for all rows to 3 significant figures:
- For : (or )
- For :
- For :
- For :
- For :
Answer
| 60.0 | 24.0 | 36.0 | 864 |
| 70.0 | 21.0 | 49.0 | 1030 |
| 80.0 | 19.5 | 60.5 | 1180 |
| 90.0 | 18.6 | 71.4 | 1330 |
| 100.0 | 17.8 | 82.2 | 1460 |
Values of (u × v): 864 (or 860), 1030, 1180, 1330, 1460
Walkthrough
- Insert the calculated values of and into the first row corresponding to .
- For each row in Table 3.1, calculate the product :
- :
- :
- :
- :
- :
- Round every calculated value to exactly 3 significant figures as explicitly instructed in the question.
Key Takeaways
- Always follow rounding instructions in table completion questions precisely (here, 3 significant figures).
Common Mistakes
- Writing raw unrounded numbers (e.g. , ).
Things to Be Careful About
- Trailing zeros are required to show 3 significant figures (e.g. , , , ).
Use the grid provided in Fig. 3.4 on page 13 to plot a graph of on the y-axis against on the x-axis.
You do not need to start your axes at the origin (0,0).
Draw the straight line of best fit.
Answer
Plot the graph using the following criteria:
- Axes: Label the horizontal x-axis as and the vertical y-axis as .
- Scales: Linear, sensible scales using more than half the grid in both directions. (e.g. x-axis starting at or , y-axis starting at ).
- Plotting: Plot the five points precisely to within half a small square:
- Line of best fit: Draw a single, clean, thin straight line that passes evenly through the plotted points.
Graph plotted with correctly labelled axes, sensible non-origin scales, accurately plotted points, and a thin straight line of best fit.
Walkthrough
To construct the graph:
- Axes and Labels: Clearly write on the y-axis and on the x-axis, including the full quantity and unit.
- Choosing Scales:
- ranges from to . A good scale starts at or with represented by or on the grid.
- ranges from to . A good scale starts at with represented by or of grid.
- Do not use awkward scale multiples (such as units of 3 or 7).
- Plotting Points: Mark each data pair with a small neat cross ( or ) to within half a small square of accuracy.
- Line of Best Fit: Using a long ruler, draw a single straight line that balances the points on either side without forcing it through any single outlier or origin.
Key Takeaways
- The plotted area should occupy more than half the grid in both directions.
- Always use small, precise crosses for data points.
Common Mistakes
- Forcing the line to start from when non-zero origins were specified.
- Drawing thick, 'feathered', or double lines.
Things to Be Careful About
- Ensure units are included in the axis labels.
The focal length of the lens is numerically equal to the gradient of the line.
Calculate the gradient of the line. Show all working and indicate on your graph in Fig. 3.4 the values you use.
= ______
Working
Select two points on the line of best fit separated by more than half the length of the line, e.g. and :
Answer
15.0 cm
Walkthrough
- Choose two widely spaced coordinates on the drawn best-fit line (not data points from the table unless they lie directly on the line) such that the triangle covers at least half the length of the drawn line.
- Read the coordinates and from the graph grid.
- Compute the gradient using:
- For representative values and :
Any accurately determined value in the range to scores full marks.
Key Takeaways
- To obtain maximum accuracy, gradient triangles must span at least half the length of the plotted line.
- Coordinates must be read from the line of best fit, not copied from the table.
Common Mistakes
- Using a triangle that covers less than half the drawn line.
- Using raw data points that do not lie on the line of best fit.
Things to Be Careful About
- Keep track of units: .
The lens manufacturer states that the focal length of the lens is .
Decide, with a calculation, whether your value of agrees with this statement and tick the box that shows your answer.
calculation:
[ ] My value for agrees with the manufacturer's statement.
[ ] My value for does not agree with the manufacturer's statement.
Working
Acceptable range for :
Since the experimental value lies within the range to , the result agrees.
Answer
[x] My value for agrees with the manufacturer's statement.
[x] My value for f agrees with the manufacturer's statement.
Walkthrough
- Calculate the acceptable limits for the focal length according to the manufacturer's statement ():
- of
- Lower limit
- Upper limit
- Compare the experimental value of from (c)(iii) (e.g. ) with this range:
- Since is between and , tick the 'agrees' box.
(If a candidate's value of fell outside this range, ticking 'does not agree' with corresponding calculation would also receive credit).
- Since is between and , tick the 'agrees' box.
Key Takeaways
- To test if a value agrees within , calculate the numerical upper and lower bounds and check whether the experimental result lies inside them.
Common Mistakes
- Ticking a box without showing any numerical calculation.
Things to Be Careful About
- Ensure the calculation clearly states the range or percentage difference.
Plan an experiment to investigate how the thickness of a metal wire affects its resistance.
The resistance of a wire can be found using the equation:
The following apparatus is available:
- six lengths of metal wire, each of different thickness
- an ammeter
- a voltmeter
- a power supply
- several connecting leads
- a micrometer.
Other apparatus normally available in a school laboratory can also be used.
In your plan, you should:
- draw a circuit diagram to show how you will use the apparatus
- explain briefly how to carry out the investigation
- state the key variables to keep constant
- draw a table, with column headings, to show how to display readings (you are not required to enter any readings in the table)
- explain how to use these readings to reach a conclusion.
Circuit diagram
Method
- Use the micrometer to measure the diameter (thickness) of each wire.
- Connect the circuit as shown, placing one test wire in the series circuit at a time.
- Record the ammeter reading (current ) and the voltmeter reading (p.d. ) for that wire.
- Calculate the resistance of the wire using
Repeat for each wire of different thickness.
Variables to keep constant
- the length of each wire
- the material of each wire
Results table
| Wire | Thickness (diameter) / mm | p.d. / V | current / A | Resistance / Ω |
|---|---|---|---|---|
Conclusion
Compare the calculated resistances for the different wire thicknesses. If the resistance values are different, then the thickness of the wire affects its resistance. If they are all the same, then thickness does not affect the resistance in this experiment.
Circuit diagram; method using micrometer and measuring V and I; length and material kept constant; table with thickness/diameter and resistance with units; conclusion comparing resistance values for different thicknesses.
Walkthrough
This is a planning question, so you need to give a complete experimental plan. Each bullet in the question is a different marking point.
First, draw the circuit. The ammeter must be in series with the wire, because it measures the same current that passes through the wire. The voltmeter must be in parallel with the wire only, because it measures the p.d. across just the wire.
Second, describe the method. The thickness of the wire is too small to measure with a ruler, so use a micrometer. For each wire, connect it in the circuit, record the current and p.d., then calculate the resistance using the given equation .
Third, state the variables to keep constant. To make a fair test, only the thickness should change. Therefore the length and the material of every wire must be the same.
Fourth, draw a results table. The table must have a column for the independent variable (thickness/diameter) and a column for the dependent result (resistance). Every column heading must include its unit.
Finally, write the conclusion. The conclusion must be based on the readings: compare the resistance values. If they are different for different thicknesses, then thickness affects resistance; if they are the same, it does not.
Key Takeaways
- A plan question is marked by separate components: apparatus, circuit, method, controlled variables, table and conclusion.
- The ammeter is placed in series; the voltmeter is placed in parallel with the component being measured.
- A micrometer is used for small lengths such as wire thickness.
- A fair test requires only one variable to change; all other relevant variables must be kept constant.
- A results table should have column headings that include both the quantity and its unit.
- The conclusion must be justified by the readings, not just stated as a known fact.
Common Mistakes
- Putting the voltmeter in series or the ammeter in parallel.
- Measuring wire thickness with a ruler, which is not accurate enough.
- Failing to control the length or material of the wire.
- Writing table headings without units, such as just "resistance" instead of "resistance / Ω".
- Giving a conclusion such as "thinner wire has more resistance" without explaining that it comes from comparing the readings.
Things to Be Careful About
- Use the micrometer reading to the precision it allows, often to 0.01 mm.
- The voltmeter must be connected across the test wire only, not across the whole circuit.
- State clearly that length and material are kept constant so that only the thickness is changing.
- In the table, units belong in the column headings, not repeated in every cell.
- If you choose to plot a graph, plot resistance against thickness/diameter so the relationship can be seen clearly.