Physics 5054/32 — May/June 2024
Cambridge O-Level · Practical Test · worked solutions for every part, with the mark scheme
Topics Experimental Contexts · Observations and Measurements · Analysis, Conclusions and Evaluation · Use of Techniques, Apparatus and Materials · Planning Experiments and Investigations
In this experiment you will investigate the resistance of a diode when different currents flow through it.
You are provided with:
- a power source
- an ammeter
- a voltmeter
- a diode
- a 3.3 resistor, a 6.8 resistor and a 10 resistor
- a switch
- a resistor labelled P
- two spare connecting leads.
The supervisor has set up the circuit shown in Fig. 1.1.
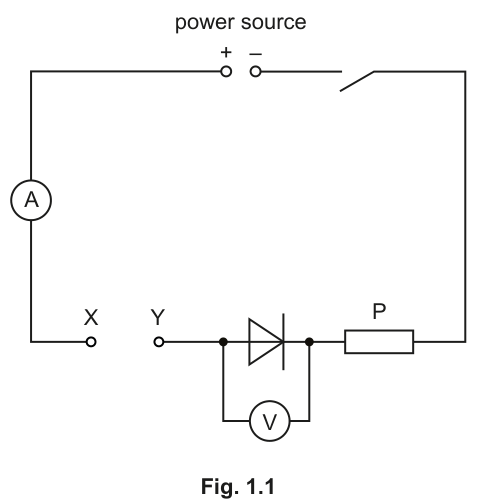
- Use a spare connecting lead to connect the terminals X and Y together.
- Close the switch.
- Record the voltmeter reading in the top row of Table 1.1.
- Record the ammeter reading in the top row of Table 1.1.
- Open the switch and remove the connecting lead.
Answer
Voltmeter reading
Ammeter reading
(Note: As this is a practical experiment, any readings within the ranges to and to , recorded to the correct precision, will score.)
V = 0.75 V, I = 0.35 A (representative values within the acceptable ranges)
Walkthrough
The candidate is asked to short-circuit terminals X and Y with a lead, close the switch, and record the initial readings. The voltmeter is connected in parallel across the diode, so it measures the potential difference across the diode. The ammeter is in series, measuring the total current. The candidate must read the voltmeter to at least 1 decimal place (e.g., ) and the ammeter to at least 2 decimal places (e.g., ). The mark scheme specifies acceptable ranges: between and , and between and .
Key Takeaways
- Voltmeters are connected in parallel across the component whose p.d. is being measured.
- Ammeters are connected in series to measure the current flowing through the circuit.
- Readings must be recorded to the precision allowed by the instrument's scale, including trailing zeros where appropriate.
Common Mistakes
- Recording the ammeter reading to only 1 decimal place (e.g., instead of ).
- Reading the voltmeter or ammeter incorrectly due to parallax error (not viewing the scale at eye level).
- Forgetting that the voltmeter measures the p.d. across the diode only, not the total p.d. of the power source.
Things to Be Careful About
- The mark scheme requires to at least 1 decimal place and to at least 2 decimal places. A reading like or would not score.
- The values must fall within the specified ranges ( and ); values outside these indicate a faulty setup or incorrect instrument selection.
- Always open the switch and remove the lead before moving to the next step to avoid altering the circuit or damaging components.
Table 1.1
| resistance between X and Y / | voltmeter reading / | ammeter reading / | resistance of diode / |
|---|---|---|---|
| 0 | |||
| 3.3 | |||
| 6.8 | |||
| 10 |
- Use both spare connecting leads to connect the 3.3 resistor between terminals X and Y.
- Close the switch.
- Record the voltmeter reading in Table 1.1.
- Record the ammeter reading in Table 1.1.
- Open the switch and remove the connecting leads and the 3.3 resistor.
Answer
Voltmeter reading
Ammeter reading
(Note: Any readings where neither is zero and (the value from part a), with to at least 2 d.p., will score.)
V = 0.65 V, I = 0.25 A (representative values)
Walkthrough
The candidate connects the resistor between terminals X and Y. This adds resistance in series with the rest of the circuit, so the total resistance increases and the current must decrease. The candidate records the new and readings. The ammeter reading must be less than the value recorded in part (a) (e.g., ) and must be recorded to at least 2 decimal places. Neither reading should be zero.
Key Takeaways
- Adding resistance in series increases the total circuit resistance, which decreases the current for a constant supply voltage.
- The diode is a non-ohmic conductor; its resistance changes with current, so the voltage across it will also change, but not proportionally.
Common Mistakes
- Forgetting to open the switch before connecting the resistor, which could cause a short circuit or damage.
- Recording the ammeter reading without the required precision (2 d.p.).
- Assuming the voltage across the diode will remain exactly constant; it will change slightly as the current changes.
Things to Be Careful About
- Ensure the resistor is connected between X and Y, not in parallel or across other components.
- The ammeter reading must be strictly less than the reading in part (a). If it is not, the circuit is not assembled correctly or the resistor is faulty.
- Record readings immediately after closing the switch to avoid heating effects altering the diode's resistance.
Answer
For resistor: ,
For resistor: ,
(Note: A complete set of readings for all three resistors is required. Values must show decreasing as resistance increases.)
Complete table with representative readings for 6.8 Ω and 10 Ω resistors.
Walkthrough
The candidate repeats the procedure from part (b) using the and resistors. Each time, the total resistance increases, so the current decreases further. The candidate records and for both resistors, completing the table. The ammeter readings must continue to decrease (e.g., and ). The voltmeter readings will also decrease slightly or remain relatively constant (diodes have a relatively flat V-I characteristic in the forward-biased conducting region).
Key Takeaways
- A good experiment requires a sufficient range of values for the independent variable (here, the resistance between X and Y) to observe the trend clearly.
- The candidate must systematically change one variable at a time and record the corresponding dependent variables.
Common Mistakes
- Failing to remove the previous resistor before connecting the next one.
- Not opening the switch between measurements.
- Recording only two sets of readings instead of all three required.
Things to Be Careful About
- Ensure the table is completed for all three resistors (, , ) to earn the mark.
- The current must decrease monotonically as the added resistance increases.
Calculate the resistance of the diode for each pair of readings of and , using the equation:
Record your answers in Table 1.1.
Working
Using :
For between X and Y:
For between X and Y:
For between X and Y:
For between X and Y:
Answer
| resistance between X and Y / | voltmeter reading / | ammeter reading / | resistance of diode / |
|---|---|---|---|
| 0 | 0.75 | 0.35 | 2.1 |
| 3.3 | 0.65 | 0.25 | 2.6 |
| 6.8 | 0.62 | 0.18 | 3.4 |
| 10 | 0.61 | 0.15 | 4.1 |
(Note: All calculated values must be correct based on the recorded and values, and the trend must show increasing as decreases.)
Table completed with calculated R values: 2.1, 2.6, 3.4, 4.1 Ω
Walkthrough
The candidate calculates the resistance of the diode for each row using the equation . They must substitute the recorded values of and and compute , rounding to an appropriate number of significant figures (usually 2 or 3). The mark scheme also looks for the correct trend: as the current decreases (due to adding more series resistance), the calculated resistance of the diode increases. This is because the diode's resistance is not constant; it is lower at higher currents.
Key Takeaways
- Resistance can be calculated from simultaneous voltage and current readings using Ohm's law: .
- For non-ohmic components like diodes, the resistance is not constant and depends on the current flowing through it.
Common Mistakes
- Forgetting to calculate for all four rows.
- Using the wrong values of and (e.g., mixing up rows).
- Not noticing or stating the trend that increases as decreases.
- Rounding errors in the calculation.
Things to Be Careful About
- Ensure all values are present and correct. An error carried forward (ecf) from part (c) will be accepted if the calculation is applied correctly to the (incorrect) readings.
- The trend 'R values increasing as I decreases' is a separate mark; it must be explicitly stated or clearly visible in the table.
As the resistance between terminals X and Y is changed, the current in the circuit changes.
Examine your results in Table 1.1.
Describe how the change in current affects:
Answer
As the current decreases, the voltage across the diode decreases (or there is little or no change in voltage).
As the current decreases, the voltage across the diode decreases (or changes very little).
Walkthrough
The candidate examines the recorded voltages as the current decreases from to . The voltage drops slightly from to . The candidate must describe this relationship: as current decreases, voltage decreases. Alternatively, because the change is small, stating 'little or no change in voltage' is also acceptable for this mark. The key is to link the change in current to the change in voltage.
Key Takeaways
- Diodes are non-ohmic; their V-I characteristic is non-linear.
- In the forward-biased conducting region, the voltage across a silicon diode is roughly constant (around ), but it does decrease slightly as current decreases.
Common Mistakes
- Stating 'voltage is constant' without acknowledging the slight decrease, though 'little or no change' is accepted.
- Describing the relationship in reverse without linking it to the current change (e.g., just saying 'voltage is lower' without saying 'as current decreases').
Things to Be Careful About
- Use the word 'as' to show the correlation (e.g., 'as the current decreases, the voltage...').
- Do not say 'voltage decreases because resistance increases' in this part; that is for part (ii). Just describe the observed trend from the data.
Answer
As the current decreases, the resistance of the diode increases.
As the current decreases, the resistance of the diode increases.
Walkthrough
The candidate looks at the calculated resistance values in the last column: , , , . As the current decreases ( down to ), the resistance increases. The candidate must state this inverse relationship. This demonstrates that the diode is a non-ohmic conductor whose resistance is current-dependent.
Key Takeaways
- The resistance of a diode is not constant; it decreases as the current through it increases.
- This is a key characteristic of non-ohmic conductors and is often examined in practical papers.
Common Mistakes
- Stating 'resistance is constant' (which would be true for an ohmic conductor at constant temperature, but not for a diode).
- Failing to link the change in resistance to the change in current (e.g., just saying 'resistance increases' without mentioning current).
Things to Be Careful About
- The mark scheme accepts the reverse relationship: 'as the current increases, the resistance decreases'.
- Ensure the statement is based on the data calculated in part (d).
A student sets up a circuit using the diagram shown in Fig. 1.1.
The student finds that, when the connecting lead is connected across the terminals X and Y and the switch is closed, the ammeter does not give a reading.
The ammeter is not broken.
Suggest the error that the student has made while assembling the circuit.
Answer
The diode is connected the wrong way around (flipped in the wrong direction).
(Alternatively: the power supply or ammeter is connected the wrong way around.)
The diode is connected the wrong way around (or reversed).
Walkthrough
The student finds that the ammeter gives no reading when the switch is closed with X and Y shorted. The ammeter is not broken, so there is no current flowing. The circuit contains a diode, which only allows current to flow in one direction (forward-biased). If the diode is connected in reverse bias (the cathode connected to the positive terminal of the power supply), it will block the current, resulting in zero ammeter reading. Therefore, the most likely error is that the diode is connected the wrong way around. Other possible errors include the power supply or ammeter being reversed, though diode reversal is the most common and specific to this circuit.
Key Takeaways
- Diodes are directional components; they only conduct current in one direction (from anode to cathode, indicated by the arrow in the circuit symbol).
- If a diode is connected in reverse bias, it acts as an open circuit, and no current will flow.
- When diagnosing circuit faults, consider the properties of the components involved.
Common Mistakes
- Suggesting the switch is faulty or the battery is dead (the mark scheme specifically looks for a connection error with the diode, power supply, or ammeter).
- Saying 'the diode is broken' (the question implies the error is in assembly, not component failure).
- Not specifying which component is reversed (e.g., just saying 'something is reversed').
Things to Be Careful About
- The mark scheme accepts 'diode', 'power supply', or 'ammeter' connected the wrong way around. However, diode reversal is the most physically meaningful answer given the context of investigating a diode.
- Do not suggest adding a resistor or changing the voltage; the error is in the assembly direction.
In this experiment you will investigate the rate of cooling of hot water in a test-tube under different conditions.
You are provided with:
- a test-tube
- a 250 glass beaker
- a thermometer, to , graduated in intervals
- a 100 or 250 measuring cylinder
- a stop-watch
- a clamp, boss and stand
- a supply of hot water (approximately )
- a supply of cold water (at room temperature)
- a supply of warm water (approximately ).
The test-tube has been arranged as shown in Fig. 2.1.
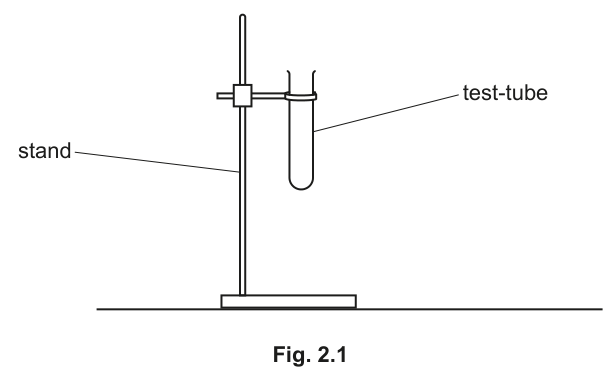
- Pour 200 of cold water into the beaker.
- Ask the supervisor to pour hot water into the test-tube until it is approximately one-third full.
- Lower the test-tube into the beaker of cold water until the level of the hot water in the test-tube is below the level of the cold water in the beaker. See Fig. 2.2.
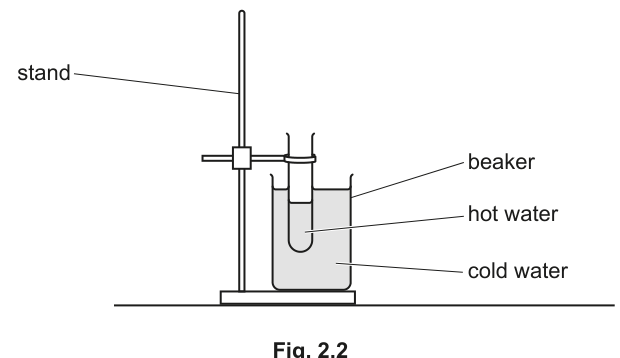
- Place the thermometer into the test-tube.
- Wait for approximately 30 s before measuring the temperature and starting the stop-watch.
Measure the temperature of the hot water in the test-tube and start the stop-watch immediately.
Record the temperature at time in the second column of Table 2.1.
Answer
Record the initial temperature of the hot water in the test-tube at . A typical reading would be .
| time / s | test-tube cooling in cold water temperature / |
|---|---|
| 0 | 80 |
Initial temperature recorded at , e.g. (must be higher than subsequent readings in the column).
Walkthrough
The first step in any cooling experiment is to establish the starting temperature. The candidate reads the thermometer at and records it in the table. This value must be higher than all subsequent readings in that column, as the water is cooling down.
Key Takeaways
Every cooling experiment requires an initial temperature reading at to serve as the baseline for calculating temperature decreases.
Common Mistakes
- Recording the temperature of the water in the beaker instead of the test-tube.
- Forgetting to include the unit in the table heading or data.
- Recording a value lower than subsequent readings (which would imply heating, not cooling).
Things to Be Careful About
- The thermometer is graduated in intervals, so readings should be recorded to the nearest (no decimal places needed).
- Ensure the stopwatch is started at the exact same moment the temperature is read at .
Table 2.1
| time / | test-tube cooling in cold water temperature / | test-tube cooling in warm water temperature / |
|---|---|---|
| 0 | ||
| 30 | ||
| 60 | ||
| 90 | ||
| 120 | ||
| 150 | ||
| 180 |
Measure the temperature of the hot water every 30 s for 180 s. Record your readings in the second column of Table 2.1.
Answer
| time / s | test-tube cooling in cold water temperature / | test-tube cooling in warm water temperature / |
|---|---|---|
| 0 | 80 | 80 |
| 30 | 72 | 75 |
| 60 | 65 | 71 |
| 90 | 59 | 68 |
| 120 | 54 | 65 |
| 150 | 50 | 63 |
| 180 | 47 | 61 |
*Note: The above are representative readings. Actual values will depend on the experiment, but must show a decreasing trend
Full set of readings recorded every 30 s for 180 s, showing a decreasing temperature trend in both columns.
Walkthrough
The candidate must read the thermometer every 30 seconds for a total of 180 seconds. This gives 7 data points per column (at ). The temperatures must decrease over time as the hot water loses thermal energy to the surrounding water in the beaker.
Key Takeaways
Cooling curves show a decreasing temperature over time. The rate of cooling is typically faster at the beginning when the temperature difference is largest.
Common Mistakes
- Not recording all 7 time points (missing one or more).
- Recording temperatures that increase or stay the same (violating the physics of cooling).
- Inconsistent decimal places (though here, whole numbers are expected due to the graduation).
Things to Be Careful About
- Read the thermometer to the nearest .
- Ensure the stop-watch is running continuously and readings are taken at exactly 30, 60, 90, etc., seconds.
Describe in detail one precaution that you take to make sure that the temperature measurements are as accurate as possible.
Answer
One valid precaution is: Stir the water in the test-tube gently before taking each temperature reading to ensure the temperature is uniform throughout the liquid.
Other acceptable answers include:
- Read the thermometer scale at right angles (eye level) to avoid parallax error.
- Ensure the thermometer bulb does not touch the sides or base of the test-tube.
- Wait a few seconds after the reading stabilizes before recording it.
- Keep the stop-watch close to the test-tube to minimize reaction time errors.
Stir the water before reading, or read the thermometer at eye level, or ensure the thermometer does not touch the sides/base of the test-tube.
Walkthrough
To ensure accurate temperature measurements, the candidate must minimize errors from temperature gradients, parallax, and heat loss. Stirring ensures the water in the test-tube is at a uniform temperature. Reading at eye level prevents parallax error on the thermometer scale. Avoiding contact with the glass prevents the thermometer from reading the glass temperature rather than the water temperature.
Key Takeaways
Accurate temperature measurements in cooling experiments require uniform temperature (stirring), correct viewing angle (no parallax), and isolation from apparatus temperatures (thermometer not touching glass).
Common Mistakes
- Stating "be more careful" (too vague, not credited).
- Saying "use a better thermometer" (does not address the technique).
- Forgetting that the thermometer must not touch the glass.
Things to Be Careful About
- The mark scheme accepts any one valid precaution. Do not list multiple unless asked.
- "Stirring" is a very strong answer because water is a poor conductor of heat, and without stirring, the top of the water in the test-tube may cool faster than the bottom.
- Empty the test-tube.
- Empty the cold water from the beaker.
- Pour 200 of warm water into the beaker.
- Ask the supervisor to pour hot water into the test-tube until it is approximately one-third full.
- Lower the test-tube into the beaker of warm water until the level of the water in the test-tube is below the level of the warm water in the beaker.
- Place the thermometer into the test-tube.
- Wait for approximately 30 s before measuring the temperature and starting the stop-watch.
Repeat the steps described in (a)(i) and (a)(ii), recording your results in the third column of Table 2.1.
Answer
| time / s | test-tube cooling in cold water temperature / | test-tube cooling in warm water temperature / |
|---|---|---|
| 0 | 80 | 80 |
| 30 | 72 | 75 |
| 60 | 65 | 71 |
| 90 | 59 | 68 |
| 120 | 54 | 65 |
| 150 | 50 | 63 |
| 180 | 47 | 61 |
Note: The third column shows temperatures decreasing, but more slowly than in the cold water.
Temperatures decreasing over time, but decreasing more slowly than in the cold water column.
Walkthrough
The experiment is repeated with warm water () in the beaker. The hot water in the test-tube () will still cool down, but the rate of cooling will be slower because the temperature difference between the hot water and the surrounding warm water is smaller than when the surrounding water was cold ().
Key Takeaways
The rate of cooling depends on the temperature difference between the object and its surroundings. A smaller temperature difference results in a slower rate of cooling.
Common Mistakes
- Recording temperatures that decrease faster than in the cold water (physically incorrect).
- Forgetting that the initial temperature should still be the same ().
Things to Be Careful About
- The third column must show a decreasing trend, but the values should be higher (closer to the initial temperature) than the second column at the same time intervals.
Calculate the temperature decrease of the hot water in the test-tube after cooling for 180 s in both the beaker of cold water and the beaker of warm water.
Use your temperature readings in Table 2.1.
temperature decrease when cooling in the cold water = ______
temperature decrease when cooling in the warm water = ______
Working
Using the representative readings from Table 2.1:
Cooling in cold water:
Cooling in warm water:
Answer
temperature decrease when cooling in the cold water = 33
temperature decrease when cooling in the warm water = 19
Cold water: 33 ; Warm water: 19 (values depend on candidate's readings, but both calculations must be correct).
Walkthrough
The candidate subtracts the final temperature (at s) from the initial temperature (at s) for both columns. This gives the total temperature decrease over the 180-second period.
Key Takeaways
Temperature decrease is calculated as . This value is used to compare the rates of cooling.
Common Mistakes
- Subtracting in the wrong order (e.g., final - initial, giving a negative number).
- Using the wrong row (e.g., using the temperature at s instead of s).
- Forgetting to include the unit .
Things to Be Careful About
- The question asks for the temperature decrease, which is a positive quantity. Ensure the calculation yields a positive value.
Use your answers to (d) to decide how the temperature of the water in the beaker affects the rate of cooling of hot water in the test-tube.
State your conclusion.
Answer
Conclusion: The rate of cooling of the hot water is greater (faster) when the water in the beaker is cold compared to when it is warm.
Justification:
The temperature decrease in cold water is , while in warm water it is only over the same 180 s. The larger temperature decrease in the cold water indicates a faster rate of cooling.
Alternatively, calculating rates:
- Rate in cold water:
- Rate in warm water:
The rate is greater in cold water.
Cooling is faster in cold water (larger temperature decrease / greater rate of cooling), justified by the data (e.g., 33 °C decrease vs 19 °C decrease).
Walkthrough
The candidate must compare the temperature decreases calculated in part (d). A larger decrease in the same time means a faster rate of cooling. The conclusion is that a larger temperature difference between the hot water and the surrounding water leads to a faster rate of cooling.
Key Takeaways
Newton's Law of Cooling (qualitatively): the rate of heat loss is proportional to the temperature difference between the object and its surroundings. A larger difference (cold water beaker) means faster cooling.
Common Mistakes
- Stating "cold water cools faster" without specifying what is cooling (the hot water in the test-tube).
- Failing to justify the conclusion with data from the table.
- Saying "temperature difference causes cooling" without stating the relationship (larger difference = faster cooling).
Things to Be Careful About
- The conclusion must be directly supported by the data. Quote the temperature decreases or rates.
- Do not say "cold water cools the hot water more"; say "the rate of cooling of the hot water is greater".
Suggest one improvement to the experimental procedure described in (a) and (c) that allows a more valid comparison to be made between the two rates of cooling.
Answer
One improvement is to ensure the initial temperature of the hot water in the test-tube is the same in both experiments.
Other acceptable improvements include:
- Use a measuring cylinder to add the same volume of hot water to the test-tube in both cases.
- Lag the beaker (e.g., wrap it in insulating material) so that the water in the beaker does not cool down significantly during the experiment.
- Carry out both experiments at the same time using two identical setups.
- Stir both test-tubes at the same frequency.
Ensure same initial temperatures, use equal volumes of hot water, lag the beaker, or carry out both experiments simultaneously.
Walkthrough
To make a valid comparison, the candidate must control variables other than the beaker water temperature. The original procedure does not explicitly state that the initial temperature or volume of hot water in the test-tube is the same for both runs. If the initial temperatures differ, the temperature differences at later times will not be directly comparable.
Key Takeaways
A fair test requires controlling all variables except the independent variable (beaker water temperature). Initial conditions (temperature, volume) must be identical.
Common Mistakes
- Suggesting "use a better thermometer" (does not make the comparison more valid).
- Saying "repeat the experiment" (improves reliability, not validity).
- Forgetting that the beaker water itself cools down during the experiment (hence lagging the beaker is a good answer).
Things to Be Careful About
- The improvement must make the comparison between the two rates of cooling more valid, not just more reliable.
- "Same initial temperature" is the most direct answer, as the rate of cooling depends on the temperature difference at each moment.
In this experiment you will investigate the balancing of a loaded metre rule.
You are provided with:
- a metre rule with a load of mass fixed to it
- a pivot
- a set of 10 g slotted masses.
The position of the load has been fixed, with its centre directly above the 5.0 cm mark.
Do not attempt to adjust the position of the fixed load during the experiment.
- Place the pivot under the 50.0 cm mark of the rule.
- Using the 10 g slotted masses, place another load of mass on the rule.
- Adjust the position of the load of mass until the rule is as close to balanced as possible as shown in Fig. 3.1.
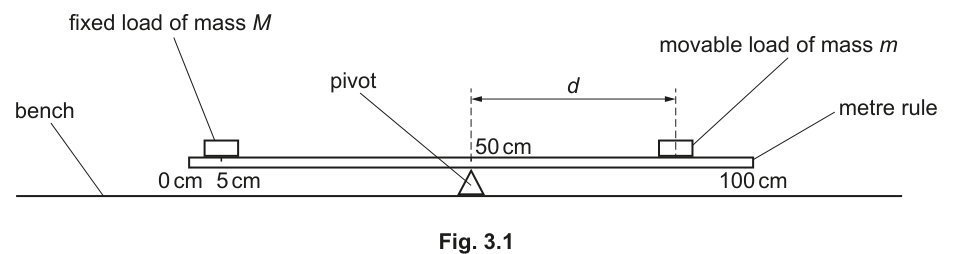
Measure and record, to the nearest 0.1 cm, the distance from the centre of the 50 g mass to the 50.0 cm mark on the rule when the rule is balanced.
= ______
Working
Record the measured distance from the mark to the centre of the mass to the nearest (e.g. , where ).
Answer
45.0 cm (example reading recorded to the nearest 0.1 cm with d < 50.0 cm)
Walkthrough
In this practical test part, the candidate adjusts the position of the movable mass until the metre rule balances horizontally on the pivot placed at the mark.
The distance is measured from the pivot (at ) to the centre of the movable load. Because a standard metre rule has millimeter divisions, readings must be recorded to the nearest (or ). Furthermore, since the rule ends at , the maximum possible distance from the pivot to the end of the rule is , so must be strictly less than .
Key Takeaways
- Always record metre rule measurements to the nearest (including a trailing zero, e.g., rather than ).
- Check that measured values are physically possible within the dimensions of the apparatus.
Common Mistakes
- Omitting the trailing zero (e.g. writing instead of ).
- Recording the mark on the rule (e.g. ) instead of the distance from the mark.
Things to Be Careful About
Ensure the measurement is taken from the pivot position () to the centre of mass of the slotted load, not its edge.
It is difficult to balance the rule exactly.
Describe the technique you use to make sure that your value of is as accurate as possible.
Answer
Adjust the position of the mass slowly until the rule just tilts one way, then move it back until it just tilts the other way, and take the midpoint between these two positions.
Find the positions where the rule just tilts each way and take the midpoint
Walkthrough
Friction at the pivot often prevents a beam from settling into a perfect horizontal position immediately. To overcome this and locate the true equilibrium position:
- Move the load slowly until the rule just tips downward on the right.
- Move the load back until the rule just tips downward on the left.
- Place the load midway between these two tipping points.
Alternatively, candidates can note the position of both outer edges of the cylindrical mass on the ruler scale and average them to find the exact centre of the mass.
Key Takeaways
- Balancing experiments require finding the sensitivity limits (the positions where tipping occurs) and averaging them.
Common Mistakes
- Giving vague answers such as "look carefully", "be more accurate", or "keep your eye level".
Things to Be Careful About
State clear, operational steps that describe how the mass is manipulated to find the balance point.
Repeat (a) for values of mass from 60 g to 100 g.
Record all your readings in Table 3.1. Include your readings from (a).
Table 3.1
| mass / | distance / | / |
|---|---|---|
Answer
| mass / | distance / | / |
|---|---|---|
| 50 | 45.0 | 22.2 |
| 60 | 37.5 | 26.7 |
| 70 | 32.1 | 31.2 |
| 80 | 28.1 | 35.6 |
| 90 | 25.0 | 40.0 |
| 100 | 22.5 | 44.4 |
Table completed with 6 sets of data showing d decreasing as m increases
Walkthrough
The candidate records values of for (6 sets total).
From the principle of moments, clockwise moment = anticlockwise moment:
As the mass increases, the distance required to balance the fixed moment must decrease ().
All distances must be recorded to the nearest .
Key Takeaways
- In moments experiments with a constant counter-moment, increasing the load decreases the distance needed to balance.
- Ensure all 6 rows are completed with values demonstrating this inverse relationship.
Common Mistakes
- Inconsistent precision in the column (e.g. mixing and ).
- Incorrect trend where increases or remains constant.
Things to Be Careful About
Ensure data is recorded cleanly and units are already present in the column headers.
Calculate the value of for each value of .
Record your values of in Table 3.1 to an appropriate number of significant figures for this experiment.
Working
For each row, calculate:
- For :
- For :
- For :
- For :
- For :
- For :
All values are recorded consistently to 3 significant figures in Table 3.1.
Answer
Values entered in Table 3.1: , , , , ,
Values of 1000/d correctly calculated to 3 or 4 consistent significant figures
Walkthrough
For each value of recorded in Table 3.1, calculate .
Since is measured to 3 significant figures (e.g. ), the calculated quotient must be given to 3 (or 4) significant figures consistently down the whole column.
Key Takeaways
- Derived quantities should reflect the precision of raw measurements (typically 3 significant figures for length measurements of this range).
- Maintain a consistent number of significant figures across all rows in a column.
Common Mistakes
- Writing instead of for , losing significant figure consistency.
- Excessive decimal places (e.g. ).
Things to Be Careful About
Round each value properly to 3 significant figures.
On the grid provided in Fig. 3.2 on page 11, plot a graph of on the -axis against on the -axis. The axes do not need to start from the origin (0, 0).
Draw the straight line of best fit.
Answer
- Axes and labels: Label the -axis with and the -axis with (or ).
- Scales: Choose linear, sensible scales such that points occupy more than half the grid in both directions (e.g., -axis starting at with ; -axis starting at with ).
- Plotting: Plot all 6 points accurately to within half a small square.
- Line of best fit: Draw a single, thin, continuous straight line that best balances the plotted points.
Graph plotted with correctly labelled axes, sensible scales, accurately plotted points, and a thin straight line of best fit
Walkthrough
To score full marks on the graph plotting:
- Axes & Labels: The -axis must be labelled with the quantity and unit ( or ), and the -axis with (or ).
- Scales: The question explicitly states that axes do not need to start from . Choose convenient, non-awkward scales (multiples of 1, 2, or 5) such that the plotted points span at least half the grid along both the horizontal and vertical axes.
- Plotting: Plot all points using small crisp crosses () or encircled dots (), positioned within small square of their true values.
- Best-fit line: Use a transparent ruler to draw a straight line of best fit with an even distribution of points on either side. The line should be thin, sharp, and drawn with a single continuous stroke.
Key Takeaways
- Scales should make plotting straightforward and use more than half the grid.
- Avoid awkward scale divisions like 3, 7, or 9 small squares per unit.
- Best-fit lines must balance points rather than simply connecting the first and last points.
Common Mistakes
- Inverted axes (plotting on the -axis and on the -axis).
- Missing units on axes.
- Drawing thick, multiple, or "woolly" pencil lines.
Things to Be Careful About
Keep pencil lines sharp and thin. Do not force the line through the origin if the scale does not start at .
Calculate the gradient of your line. Show all working and indicate on the graph the values you use.
= ______
Working
Choose two points on the line of best fit separated by :
- Point 1:
- Point 2:
Answer
2.2
Walkthrough
To find the gradient of the straight line:
- Choose two points lying directly on the line of best fit (not data points from the table, unless they happen to lie exactly on the line).
- Ensure the points are far apart — the mark scheme requires using at least half the length of the drawn line, meaning .
- Indicate the coordinates or draw the gradient triangle clearly on the graph.
- Calculate . The value should lie in the range .
Key Takeaways
- Always use a large triangle ( half the line) to determine graph gradients.
- Read coordinates from the drawn line, not from raw data points in the table.
Common Mistakes
- Using a very small triangle (span of ).
- Calculating the gradient using a single data point ().
- Inverting the gradient formula ().
Things to Be Careful About
Check scale readings carefully when determining and from the graph grid.
The mass of the load fixed to the rule can be determined using the equation:
Use your value of from (e) to calculate the mass of the load fixed to the rule.
mass = ______
Working
Answer
50 g
Walkthrough
The mass of the load fixed to the rule is given by the relation:
Substitute the value of calculated in part (e) (e.g. ):
Accepted values for fall within (i.e. to ).
Key Takeaways
- Follow through carefully with your gradient value .
Common Mistakes
- Arithmetic errors in multiplication.
- Forgetting to write the answer to 2 or 3 significant figures.
Things to Be Careful About
Ensure the value of is consistent with your value of from part (e).
Suggest why this method of determining the mass of the load fixed to the rule is unsuitable if a movable load of mass is used.
Answer
The rule cannot be balanced because the required balance distance would be greater than , which is beyond the end of the metre rule.
The rule cannot be balanced because the balance position is beyond the end of the rule
Walkthrough
The anticlockwise moment produced by the fixed load at the mark (distance from the pivot at ) is:
To balance this with a mass , the distance needed is:
Since the metre rule ends at , the maximum possible distance from the pivot at to the end of the rule is . A distance of is off the end of the rule, making it physically impossible to balance the rule.
Key Takeaways
- The physical limits of experimental apparatus (such as ruler length) constrain the range of measurable variables.
Common Mistakes
- Stating vaguely that "40 g is too small" or "the mass is too light" without explaining that the balance point lies beyond the end of the rule.
Things to Be Careful About
Clearly link the mass being too small to the balance point falling beyond the end of the rule.
A student has a converging (convex) lens and needs to determine its focal length.
Plan an experiment that will enable the student to measure an accurate value for the focal length of the lens.
The focal length of a lens can be calculated using the equation:
where is the distance between an object and the lens and is the distance between the focussed image of the object and the lens.
Fig. 4.1 shows some of the apparatus available.
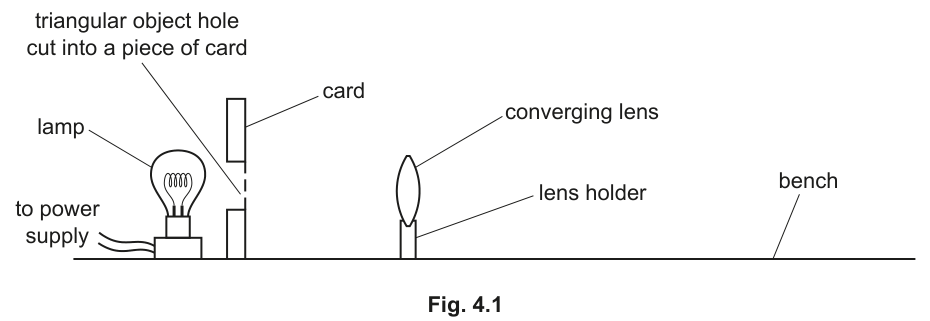
The lamp is connected to a power supply and can be switched on and off as required.
Write a plan for the experiment.
You are not required to do this experiment.
In your plan you should:
- list any additional apparatus needed
- draw a diagram of the arrangement of the apparatus, labelling and
- explain briefly how to do the experiment
- state the steps taken to obtain a sharp, focussed image
- explain how to use your readings to determine .
Answer
Additional apparatus:
A metre rule (or measuring tape) and a screen (white paper or card).
Diagram of arrangement:
Method:
- Arrange the lamp, the card with the triangular hole, the converging lens, and the screen in a straight line on the bench.
- Switch on the lamp.
- Move the lens and/or the screen along the bench until a sharp, focused image of the triangular hole is formed on the screen.
- Measure and record the distance from the card to the lens, and the distance from the lens to the screen.
Steps taken to obtain a sharp, focused image:
Move the screen (or lens) slowly forwards and backwards to find the position of the sharpest image. Ensure the object, lens, and screen are all at the same height above the bench. Carry out the experiment in a darkened room.
Determination of :
Substitute the measured values of and into the given equation to calculate . Repeat for different values of and find the average value of .
See working
Walkthrough
The question asks for a complete experimental plan to determine the focal length of a converging lens using the lens equation . We must address each bullet point in the question prompt, aligning with the mark scheme.
Additional apparatus:
The given apparatus (Fig. 4.1) includes a lamp, a card with a triangular hole, a converging lens in a holder, and a bench. To measure distances and , we need a metre rule or measuring tape. To capture a real, focused image of the triangular hole, we need a screen (a white piece of paper or card). Both are required for full credit.
Diagram of arrangement:
The components must be arranged in a straight line along the bench: lamp → card (object) → converging lens → screen (image). The distances (object distance, from card to lens) and (image distance, from lens to screen) must be clearly labelled with arrows. All components should be at the same height above the bench to ensure the image is formed on the screen.
Method:
The candidate must describe the practical steps: place the apparatus in a line, switch on the lamp, adjust the positions of the lens and screen to form an image, and then measure and record and . The mark scheme awards 2 marks here: one for moving/adjusting to get the image, and one for measuring/recording and .
Steps to obtain a sharp image:
This is a specific technique mark. The candidate should mention moving the screen or lens slowly forwards and backwards to fine-tune the focus. Other acceptable points include ensuring the object, lens, and screen are at the same height above the bench, or conducting the experiment in a darkened room to make the image clearer.
Determination of :
The candidate must state that they will substitute the measured and values into the given equation . To improve accuracy and earn the mark, they should also mention repeating the experiment for different values of (by moving the lens or the object) and calculating an average value of .
Key Takeaways
- A practical plan must explicitly list all necessary apparatus, not just what is shown in the figure.
- Diagrams for lens experiments must show the linear arrangement of object, lens, and screen, with and correctly defined and labelled.
- Technique marks are awarded for specific actions like moving components slowly to find focus, aligning heights, and working in a darkened room.
- Always mention repeating measurements and finding an average to improve accuracy in practical planning questions.
Common Mistakes
- Forgetting the screen: Candidates often assume the image is viewed directly through the lens. A real image for this experiment must be projected onto a screen.
- Incorrect labelling of and : is the distance from the object (card) to the lens, and is the distance from the lens to the image (screen). Reversing these or measuring from the bench edge loses the mark.
- Vague method: Simply saying "measure and " without explaining how the image is formed (by moving the lens/screen) misses a method mark.
- Not mentioning repeats: Substituting into the equation alone may score, but explicitly stating "repeat for different values of and find the average" is the safest way to secure the final mark.
Things to Be Careful About
- Precision: A metre rule is the standard apparatus; a measuring tape is acceptable, but a tape measure with poor rigidity might not be as accurate for bench experiments.
- Alignment: Emphasise that the object, lens centre, and screen centre must be at the same height. If they are not, the image may be cut off or not form on the screen.
- Darkened room: This is a simple but effective practical tip that earns a mark and improves the real-world quality of the experiment.
- Equation usage: The equation is given, so no derivation is needed. Focus on the practical application: measuring and and substituting them in.