Physics 5054/31 — May/June 2024
Cambridge O-Level · Practical Test · worked solutions for every part, with the mark scheme
Topics Experimental Contexts · Observations and Measurements · Analysis, Conclusions and Evaluation · Planning Experiments and Investigations · Use of Techniques, Apparatus and Materials
You will find the volume of a small glass ball (marble) by two different methods.
You are provided with:
- six similar small glass balls (marbles)
- a metre rule fixed in place on the bench
- two set squares
- a 50 measuring cylinder
- a 100 beaker containing water
- access to a top-pan (electronic) balance
- paper towels.
method 1
- Place six small glass balls by the side of the metre rule, as shown in Fig. 1.1.
- Make sure that there are no gaps between the balls.
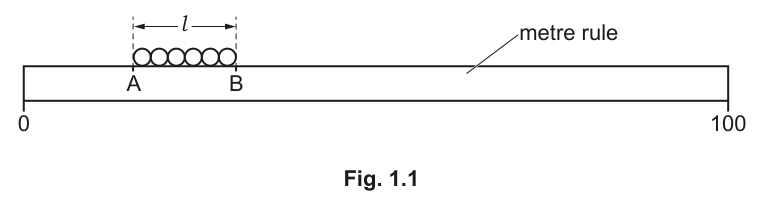
Use the set squares to help you take readings on the metre rule of the positions of points A and B, as shown in Fig. 1.1. Give your readings to the nearest 0.1 .
position of point A = ______
position of point B = ______
Answer
position of point A = 10.0 cm
position of point B = 19.5 cm
A = 10.0 cm, B = 19.5 cm
Walkthrough
In method 1, the candidate must read the positions of the start (A) and end (B) of the row of six marbles on the metre rule. The set squares are placed against the metre rule and flush against the left and right edges of the row to project vertical lines onto the scale. Reading to the nearest 0.1 cm, a typical acceptable pair of readings is A = 10.0 cm and B = 19.5 cm. The key is that the two points must be between 9.0 cm and 10.0 cm apart, matching the span of six marbles.
Key Takeaways
When measuring with a metre rule, use set squares to avoid parallax error and ensure the reading is taken exactly at the edge of the object. Always read to the smallest division on the scale (0.1 cm here) and include a trailing zero if the reading falls exactly on a major mark.
Common Mistakes
Reading the scale at an angle (parallax error) instead of using set squares. Forgetting to include the trailing zero (writing 10 instead of 10.0). Reading the wrong end of the metre rule.
Things to Be Careful About
The mark scheme accepts any two readings that are between 9.0 cm and 10.0 cm apart. Ensure the final answer is given to the nearest 0.1 cm as requested by the question.
The length is the distance between points A and B. The average diameter of one ball can be found using the equation:
Use your answers to (a)(i) to find length and diameter . Give your answers to the nearest 0.1 .
= ______
= ______
Working
Answer
= 9.5 cm
d = 1.6 cm
l = 9.5 cm, d = 1.6 cm
Walkthrough
The length is the distance between points A and B. Subtract the reading at A from the reading at B: cm. This must be given to the nearest 0.1 cm.
The average diameter of one ball is found by dividing the total length by the number of balls (6). cm. Round this to the nearest 0.1 cm as requested, giving cm.
Key Takeaways
When calculating a derived quantity from measurements, carry forward the unrounded value for subsequent calculations if possible, but report the intermediate result to the required precision. Here, is rounded to 1.6 cm for the final answer, but the unrounded value could be used in the next part.
Common Mistakes
Forgetting to subtract the two readings to find . Rounding incorrectly (e.g., rounding 1.58 to 1.5 instead of 1.6). Not including the unit cm in the final answer.
Things to Be Careful About
The question explicitly asks for answers to the nearest 0.1 cm. Ensure is calculated from the candidate's own readings in (a)(i). If the candidate's is different (e.g., 9.8 cm), would be cm anyway, but the working must match their numbers.
The average volume of one glass ball found using this method is given by the equation:
Calculate .
= ______
Working
Answer
= 2.1 cm
2.1 cm^3
Walkthrough
The volume of a sphere is given by . Since , this can be rewritten as . Using , the formula becomes .
Substitute the value of found in (a)(ii). Using cm:
Round to a sensible number of significant figures (2 or 3). cm (or 2.14 cm).
Key Takeaways
Always use the formula provided in the question. Be careful with the order of operations: cube the diameter first, then multiply by 3.14, then divide by 6.
Common Mistakes
Using the radius instead of the diameter in the formula. Forgetting to cube the diameter. Not including the unit cm.
Things to Be Careful About
The mark scheme awards the mark for correctly substituting the candidate's own value of into the formula. If the candidate used cm (unrounded), cm, which is also acceptable. Ensure the final answer has the correct unit.
method 2
- Pour water into the measuring cylinder until it is just over half full.
Answer
= 25.0 cm
25.0 cm^3
Walkthrough
The candidate pours water into the measuring cylinder until it is just over half full. A 50 cm measuring cylinder has markings typically every 1 cm or 0.5 cm. A sensible reading for 'just over half full' is around 25 cm. The candidate records this initial volume . The reading must be taken at the bottom of the meniscus (the curve in the water surface) at eye level.
Key Takeaways
When reading a liquid volume in a cylinder, always read at the bottom of the meniscus. Ensure the cylinder is on a flat, level surface.
Common Mistakes
Reading from the top of the meniscus. Not placing the cylinder on a level surface. Parallax error from viewing the scale at an angle.
Things to Be Careful About
The mark scheme accepts a sensible reading around 25 cm. The candidate's own reading will be used in subsequent calculations. Ensure the unit cm is included.
- Carefully add the six glass balls to the water in the measuring cylinder.
Record the new volume of the water and glass balls in the measuring cylinder.
= ______
The volume of the six balls is given by the equation:
Calculate .
= ______
Working
The six glass balls displace water. The total volume of the six balls is .
Using typical values: cm. The volume of 6 balls is approximately cm.
Answer
= 37.6 cm
= 12.6 cm
V2 = 37.6 cm^3, VT = 12.6 cm^3
Walkthrough
After recording , the candidate carefully adds the six glass balls to the water. The water level rises. The new volume is read from the measuring cylinder. The rise in volume equals the total volume of the six balls: .
For example, if cm and the balls add about 12.6 cm, then cm, and cm.
Key Takeaways
Water displacement is a standard method for finding the volume of an irregular or solid object. The volume of the object equals the volume of water displaced.
Common Mistakes
Spilling water when adding the balls. Not reading the new meniscus level correctly. Forgetting to subtract from to find .
Things to Be Careful About
The mark scheme requires to be at least 8 cm more than (since 6 balls have a total volume of roughly 12-13 cm). The candidate's must be calculated correctly from their own and values.
- Remove the glass balls from the measuring cylinder and dry them using the paper towel.
Calculate the average volume of one ball found using this method.
= ______
Working
Answer
= 2.1 cm
2.1 cm^3
Walkthrough
The total volume is for six balls. To find the average volume of one ball, divide by 6.
Key Takeaways
Always divide the total quantity by the number of items to find the average.
Common Mistakes
Dividing by the wrong number. Forgetting the unit cm.
Things to Be Careful About
Use the candidate's own value. If cm, then cm. The mark scheme awards the mark for the correct calculation using their previous answer.
Suggest whether method 1 or method 2 gives the more accurate value for the volume of the ball.
Explain your answer.
method giving more accurate value ______
explanation ______
Answer
method giving more accurate value: method 1
explanation: the measuring cylinder can only measure to the nearest 0.5 cm (or 1.0 cm), whereas measuring the diameter to the nearest mm is more accurate.
Method 1; the measuring cylinder has a lower precision (largest division 0.5 or 1.0 cm^3) compared to the metre rule (0.1 cm)
Walkthrough
The question asks which method gives a more accurate value for the volume of the ball. Method 1 uses a metre rule with a precision of 0.1 cm to measure the diameter. Method 2 uses a 50 cm measuring cylinder, which typically has a largest division of 0.5 cm or 1.0 cm.
When measuring small volumes like the volume of a single marble (~2 cm), the relative uncertainty in the measuring cylinder is much larger than the relative uncertainty in the metre rule measurement of the diameter. Therefore, method 1 is more accurate.
Key Takeaways
Accuracy depends on the precision of the instruments used. For small quantities, a less precise instrument (like a measuring cylinder) will give a larger percentage error than a more precise instrument (like a metre rule).
Common Mistakes
Saying method 2 is more accurate because it is a 'direct' measurement. (It is not; the cylinder's precision is too low). Using the word 'heat' instead of 'thermal energy' (not applicable here, but a common general mistake). Not explaining the link between instrument precision and accuracy.
Things to Be Careful About
The mark scheme specifically looks for the comparison of instrument precision: 'measuring cylinder can only measure to the nearest 0.5 cm / 1.0 cm' or 'measuring the diameter to the nearest mm is more accurate'. Ensure the explanation directly addresses the precision of the apparatus.
The average mass of a glass ball can be found using a small beaker and a top-pan balance.
Find the average mass of one glass ball using the small beaker and the top-pan balance supplied.
Describe your method and record the readings you take.
method ______
readings
mass of one glass ball = ______
Answer
method: place the empty beaker on the balance and tare (or record its mass), then add the six glass balls and record the new mass (or the mass of the balls). Divide the total mass of the six balls by 6.
readings:
mass of beaker = 50.0 g
mass of beaker and 6 balls = 62.6 g
mass of 6 balls = 12.6 g
mass of one glass ball = 2.1 g
Method: tare beaker, add 6 balls, read mass, divide by 6. Mass = 2.1 g
Walkthrough
To find the average mass of one glass ball, the candidate uses a top-pan balance and a small beaker. The best method is to place the empty beaker on the balance and press the 'tare' or 'zero' button so the display reads 0.0 g. Then, carefully add all six glass balls to the beaker and record the total mass. Finally, divide this total mass by 6 to find the average mass of one ball.
Alternatively, record the mass of the empty beaker, add the six balls, record the total mass, subtract the beaker's mass to get the mass of the six balls, and divide by 6.
Example readings:
Mass of beaker = 50.0 g
Mass of beaker + 6 balls = 62.6 g
Mass of 6 balls = 62.6 - 50.0 = 12.6 g
Average mass of one ball = 12.6 / 6 = 2.1 g
Key Takeaways
Using a tare function simplifies the measurement by eliminating the need to subtract the container's mass. Averaging multiple identical objects reduces the percentage error in the final result.
Common Mistakes
Not describing the method clearly (e.g., just saying 'weigh the balls'). Forgetting to divide by 6. Not including units in the readings. Not using the tare function or forgetting to subtract the beaker's mass.
Things to Be Careful About
The mark scheme awards marks for: (1) putting the beaker on the balance and taring (or recording its mass), (2) adding 6 balls and finding the total mass, (3) dividing by 6. The method must be clearly described. The final answer for the mass of one ball should be around 2.1 g (consistent with the volume and typical glass density of ~2.5 g/cm).
In this experiment, you will investigate how the temperature of the surroundings affects the rate of cooling of water.
You are provided with:
- stop-watch
- a 250 beaker
- a larger beaker (500 or 600 )
- a thermometer
- a supply of hot water
- a supply of mixed ice and water
- paper towels to mop up spillages.
Ask the supervisor to pour approximately 100 of hot water into the 250 beaker.
Measure the temperature of the water and immediately start the stop-watch. Record this temperature in the first row of Table 2.1.
Answer
The initial temperature must be at least 70 C. Using representative data for this experiment, the recorded value is:
80 C (must be 70 C)
Walkthrough
The candidate must record the initial temperature of the hot water before it has had time to cool significantly. The mark scheme requires this value to be at least 70 C to ensure a measurable temperature drop over the 4-minute period. A typical reading from the thermometer provided would be 80 C. The reading must be taken to the precision of the thermometer scale (usually 1 C or 0.5 C), and a trailing zero should be included if the scale justifies it (e.g., 80.0 C).
Key Takeaways
In cooling experiments, the initial temperature must be sufficiently high above room temperature to produce a clear, measurable rate of change over the time interval allowed.
Common Mistakes
- Recording a temperature below 70 C, which would result in a very small temperature drop and a large percentage error in the calculated cooling rate.
- Forgetting to include the unit C.
Things to Be Careful About
Ensure the thermometer bulb is fully submerged in the water but not touching the bottom or sides of the beaker, which would give a reading closer to the glass temperature rather than the water temperature. Read the meniscus at eye level.
Record in Table 2.1 the temperature of the water every 30 for 4 minutes.
Table 2.1
| 0 | |
| 30 | |
| 60 | |
| 90 | |
| 120 | |
| 150 | |
| 180 | |
| 210 | |
| 240 |
Empty the 250 beaker when you have finished taking the temperature of the water in it.
Answer
Using representative data for a typical experiment where the water cools from 80 C in room air:
| 0 | 80 |
| 30 | 73 |
| 60 | 67 |
| 90 | 62 |
| 120 | 58 |
| 150 | 54 |
| 180 | 51 |
| 210 | 48 |
| 240 | 46 |
Note: Actual values will depend on the candidate's specific readings, but they must show a steadily decreasing temperature and a decreasing rate of cooling.
See completed table above (candidate-dependent readings showing decreasing )
Walkthrough
The candidate must read the thermometer every 30 seconds for 4 minutes (240 s) and record the values in the provided table. The temperature must decrease over time. Crucially, the rate of decrease must slow down as the water approaches room temperature (Newton's Law of Cooling). The table must have the correct units in the column headings, and all temperature values must be recorded to the same number of decimal places (usually whole numbers or one decimal place, matching the thermometer's precision).
Key Takeaways
Results tables must have clear column headings with quantities and units. Data must be recorded to the precision of the instrument used. A cooling curve should show a decreasing gradient, reflecting a slowing rate of heat loss.
Common Mistakes
- Recording temperatures that increase or stay constant.
- Using inconsistent decimal places down a column (e.g., 73.0, 67, 62.5).
- Forgetting to include the unit C in the table heading.
Things to Be Careful About
Read the thermometer at eye level to avoid parallax error. Ensure the stop-watch is started exactly when the first reading is taken. Allow the thermometer to stabilize for a few seconds before recording each reading.
Calculate the average cooling rate of the water for the first 90 of the experiment. Use your readings in Table 2.1 and the equation:
where is the temperature at 0 , is the temperature at 90 and is the time of 90 .
Give the unit for .
= ______ unit ______
Working
Using the representative data from Table 2.1:
The unit is per second, written as .
Answer
0.20 C/s
Walkthrough
The candidate must calculate the average cooling rate for the first 90 seconds. This is done by finding the total temperature drop () and dividing by the time interval (90 s). Using the representative data, the drop is C. Dividing by 90 s gives C/s. The unit is derived from the formula: temperature in C divided by time in s, giving C/s.
Key Takeaways
The average rate of change is calculated as the total change in the quantity divided by the total time taken. The unit must reflect the physical quantities involved (temperature over time).
Common Mistakes
- Forgetting to subtract the final temperature from the initial temperature (getting a negative value).
- Using the wrong time value (e.g., using 60 s or 120 s instead of 90 s).
- Omitting the unit or writing it incorrectly (e.g., C s instead of C/s).
Things to Be Careful About
Ensure the calculation uses the exact readings from the candidate's own table. If the candidate's is different, the mark scheme will accept the correct calculation from their own data (ecf). The unit C/s is required for a mark.
Calculate the average cooling rate of the water for the final 90 of the experiment. Use the equation:
where is the temperature of the water at 150 , is the temperature of the water at 240 and is the time of 90 .
= ______ unit ______
Working
Using the representative data from Table 2.1:
Answer
0.089 C/s
Walkthrough
The candidate calculates the average cooling rate for the final 90 seconds (from 150 s to 240 s). Using the representative data, the temperature drop is C. Dividing by 90 s gives approximately C/s. This value will naturally be lower than because the water is closer to room temperature.
Key Takeaways
Calculating rates over different intervals allows comparison of how the rate changes over time. The calculation method is identical to the previous part, just using different data points.
Common Mistakes
- Using the wrong time interval (must be exactly 90 s, from 150 to 240).
- Arithmetic errors in the subtraction or division.
Things to Be Careful About
Give the answer to 2 or 3 significant figures, consistent with the precision of the data. The mark scheme accepts the correct calculation from the candidate's own readings.
Answer
is greater than .
Explanation: The rate of cooling is higher when the temperature difference between the water and the surroundings is larger. As the water cools, its temperature approaches room temperature, the temperature difference decreases, and less thermal energy is transferred per second, so the cooling rate decreases.
because the temperature difference between the water and the surroundings is larger at the start, leading to a faster rate of heat loss.
Walkthrough
The candidate must compare and . Based on Newton's Law of Cooling, the rate of heat loss is proportional to the temperature difference between the object and its surroundings. At the start of the experiment, the water is hot (e.g., 80 C) and the room is cool (e.g., 20 C), giving a large temperature difference of 60 C. By the end of the experiment, the water is cooler (e.g., 46 C), so the temperature difference is only 26 C. Therefore, (the initial rate) is greater than (the final rate). The explanation must mention the temperature difference and its effect on the rate of energy transfer.
Key Takeaways
The rate of cooling is not constant; it depends on the temperature difference between the object and its surroundings. A larger difference results in a faster rate of cooling.
Common Mistakes
- Stating that the rate decreases because the water has 'less heat' or 'less temperature'. (Reject 'heat' as a quantity; use 'thermal energy').
- Failing to mention the temperature difference with the surroundings.
- Saying 'gravity' or 'air resistance' affects cooling.
Things to Be Careful About
Use precise physics terminology: 'thermal energy', 'temperature difference', 'rate of heat transfer'. Do not say 'the water cools down faster at first because it has more heat'; say 'the rate of energy transfer is greater because the temperature difference is greater'.
Pour approximately 100 of iced water into the larger beaker.
Ask the supervisor to pour approximately 100 of hot water into the 250 beaker.
Carefully place the 250 beaker of hot water into the larger beaker of iced water as shown in Fig. 2.1.
Make sure that the water from the larger beaker does not spill into the smaller beaker.
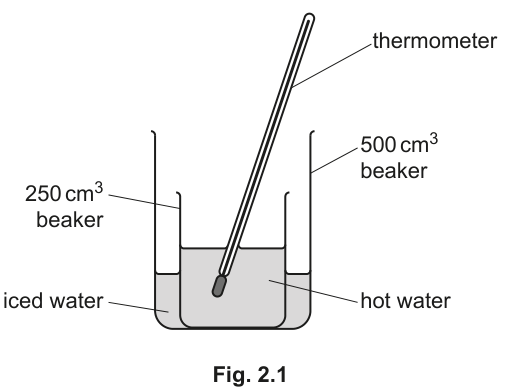
Measure the temperature of the hot water and immediately start the stop-watch.
Record, in Table 2.2, the temperature at times , 30 , 60 , 90 and 120 .
Table 2.2
Answer
Using representative data for water cooling in an iced water bath:
| 0 | 80 |
| 30 | 66 |
| 60 | 52 |
| 90 | 38 |
| 120 | 26 |
Note: Values must show a rapid decrease in temperature, significantly faster than in part (a).
See completed table above (candidate-dependent readings showing rapid cooling)
Walkthrough
The candidate repeats the temperature recording, but this time the hot water is placed in a larger beaker of iced water. The surroundings are now at approximately 0 C instead of 20 C. The temperature difference is much larger (80 - 0 = 80 C vs 80 - 20 = 60 C), so the water will cool much faster. The recorded values must reflect this rapid cooling over the 2-minute period. The table format and recording technique must be identical to part (a).
Key Takeaways
Changing the temperature of the surroundings directly affects the rate of cooling. A colder surroundings leads to a larger temperature difference and a faster rate of heat transfer.
Common Mistakes
- Recording values that are too similar to part (a), failing to show the effect of the iced water.
- Recording temperatures that go below 0 C (the water in the small beaker cannot drop below the temperature of the iced water bath, which is ~0 C).
Things to Be Careful About
Ensure the small beaker is not touching the bottom or sides of the large beaker, as this could conduct heat directly and give an artificially fast cooling rate. The water from the large beaker must not spill into the small beaker, as this would change the mass of water being cooled.
Calculate the average cooling rate for the first 90 of the experiment.
Use your readings in Table 2.2 and the equation:
= ______ unit ______
Working
Using the representative data from Table 2.2:
Answer
0.47 C/s
Walkthrough
The candidate calculates using the same formula as , but with data from the water bath experiment. Using the representative data, the temperature drop in the first 90 seconds is C. Dividing by 90 s gives C/s. This value will be significantly larger than (0.20 C/s) due to the colder surroundings.
Key Takeaways
The calculation method remains the same regardless of the experimental setup. The result will differ based on the conditions (in this case, the temperature of the surroundings).
Common Mistakes
- Using data from part (a) instead of part (b).
- Arithmetic errors.
Things to Be Careful About
Ensure the calculation uses the correct readings from Table 2.2. The mark scheme will accept the correct calculation from the candidate's own data.
Answer
is greater than .
Explanation: The iced water provides a colder surrounding environment than the room air. This creates a larger temperature difference between the hot water and its surroundings. A larger temperature difference results in a faster rate of thermal energy transfer (heat loss), so the water cools more quickly.
because the temperature difference between the hot water and the iced water is greater than the difference between the hot water and the room air, leading to a faster rate of heat transfer.
Walkthrough
The candidate must state that and explain why. The key factor is the temperature of the surroundings. In part (a), the surroundings are room air (~20 C). In part (b), the surroundings are iced water (~0 C). The temperature difference driving the heat transfer is larger in part (b) (e.g., 80 - 0 = 80 C) than in part (a) (e.g., 80 - 20 = 60 C). According to the principles of heat transfer, a larger temperature difference leads to a faster rate of energy transfer. Therefore, the cooling rate is greater than .
Key Takeaways
The rate of cooling depends on the temperature difference between the object and its surroundings. Increasing this difference (by cooling the surroundings) increases the rate of heat loss.
Common Mistakes
- Saying 'the iced water is colder so it absorbs more heat'. (Be precise: it's the difference in temperature that matters, not just the absolute temperature of the surroundings).
- Confusing conduction with convection/radiation. While conduction through the glass is involved, the primary explanation is the temperature difference driving the overall heat transfer rate.
- Not stating which rate is greater before explaining.
Things to Be Careful About
The explanation must explicitly mention the 'temperature difference' or 'temperature gradient'. Simply saying 'it is colder' is not sufficient; the candidate must link the colder surroundings to a larger temperature difference and then to a faster rate of energy transfer.
Answer
Any one of the following:
- The volume (or mass) of the hot water.
- The initial temperature of the hot water.
- The position of the thermometer in the water.
- The type and size of the beaker used for the hot water.
- The room temperature (during the first experiment).
Volume of hot water (or initial temperature, or position of thermometer)
Walkthrough
To make a valid comparison between (cooling in air) and (cooling in iced water), the only variable that should change is the temperature of the surroundings (the independent variable). All other factors that could affect the rate of cooling must be kept constant (controlled variables).
Factors that affect cooling rate include:
- Volume/mass of water: More water has more thermal energy and a larger surface area, changing the cooling rate.
- Initial temperature: Starting at different temperatures would mean comparing different points on the cooling curve.
- Thermometer position: If the bulb is near the surface or near the glass, it might read a different temperature.
- Beaker type: Different glass thicknesses or materials would affect conduction.
- Room temperature: If the room temperature changes between the two experiments, it affects the first part.
The candidate only needs to state one valid controlled variable.
Key Takeaways
In a fair test, only the independent variable is changed. All other variables that could influence the dependent variable must be controlled.
Common Mistakes
- Suggesting the 'type of room' or 'airflow' as a controlled variable without being specific (e.g., 'keep the window closed').
- Suggesting the 'time of day' as a variable.
- Stating the dependent variable (cooling rate) or independent variable (surrounding temperature) as a controlled variable.
Things to Be Careful About
Be specific. 'Volume of water' is better than 'amount of water'. 'Initial temperature' is better than 'start temperature'. Ensure the variable suggested is actually something that can be controlled in this specific experimental setup.
In this experiment, you will find the focal length of a convex lens.
You are provided with:
- a lamp
- a piece of card with a shape cut out to be the illuminated object
- a screen
- a convex lens
- a metre rule.
Fig. 3.1 shows the apparatus. The apparatus is set up for you to use.
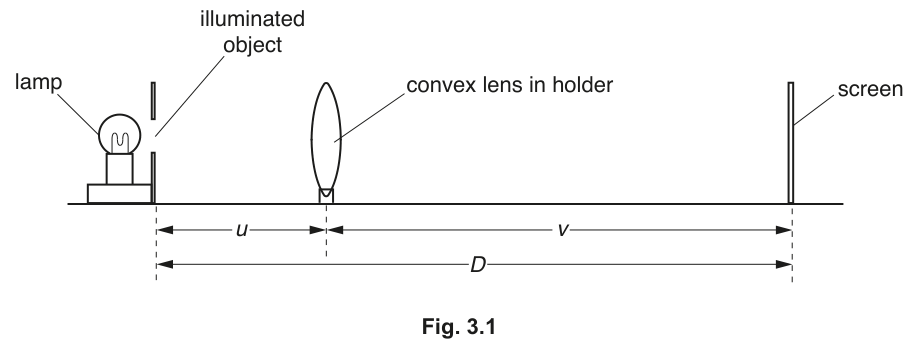
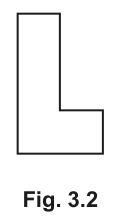
Fig. 3.2 shows the shape of the illuminated object.
- Switch on the lamp.
- Place the screen a distance from the illuminated object.
- Place the lens between the object and the screen so that the lens is about 10 away from the illuminated object.
- Move the lens slowly away from the illuminated object until a clearly focused image is formed on the screen.
Describe two differences between the illuminated object and its image on the screen.
- ______
- ______
Answer
- The image is inverted (upside down / laterally inverted).
- The image is magnified (larger than the illuminated object).
- Inverted (upside down), 2. Magnified (larger than the object)
Walkthrough
When a convex lens forms a real image on a screen with the object placed between and (or moved from near the object until the first focused image appears):
- The image produced on the screen is real and inverted (both vertically upside down and laterally inverted left-to-right).
- Since in this first position (where and or depending on focus), the image size differs from the object (it is inverted, and typically magnified or different in size).
Any two valid differences score the two marks:
- Inverted / upside down
- Laterally inverted
- Magnified / larger than the illuminated object (or diminished, depending on lens position).
Key Takeaways
- Real images formed by convex lenses on a screen are always inverted relative to the object.
Common Mistakes
- Stating that the image is "virtual" (a virtual image cannot be formed on a screen).
- Giving vague answers like "the image is brighter/dimmer" instead of geometric differences in orientation or magnification.
Things to Be Careful About
- Ensure two distinctly different features are described (e.g., orientation and size).
Measure the distance between the centre of the lens and the illuminated object for .
Record your value for to the nearest 0.1 in Table 3.1.
Table 3.1
| 60.0 | |||
| 70.0 | |||
| 80.0 | |||
| 90.0 | |||
| 100.0 |
Working
Measure the object distance with the metre rule from the illuminated object to the centre of the convex lens, recording to .
Expected experimental value is in the range to .
Answer
32.0 cm (or in the range 31.0 cm to 33.0 cm)
Walkthrough
In this practical measurement:
- Align the metre rule along the optical bench between the illuminated object and the lens.
- Read the distance to the nearest millimeter (), ensuring the value includes the trailing decimal (e.g., ).
- The mark scheme accepts values in the range ( to ).
Key Takeaways
- Standard metre rules have () divisions, so all distance measurements must be recorded to one decimal place in .
Common Mistakes
- Omitting the trailing zero (e.g., writing instead of ).
Things to Be Careful About
- View the scale perpendicularly to avoid parallax error when measuring to the centre of the lens.
Deduce the distance between the centre of the lens and the screen for . Record your value for to the nearest 0.1 in Table 3.1.
Working
Answer
28.0 cm (or 60.0 - u)
Walkthrough
Since the total separation between object and screen is , the distance from the lens to the screen is calculated by:
For an expected , (expected range to ).
Key Takeaways
- Total distance is partitioned into object distance and image distance .
Common Mistakes
- Measuring separately with an inconsistent total that does not sum to .
Things to Be Careful About
- Ensure is quoted to decimal place ().
Repeat the procedure in the stem of (a), (a)(ii) and (a)(iii) using values of , 80.0 , 90.0 and 100.0 . Record all your values for and in Table 3.1.
Working
Perform the procedure for each , recording and to the nearest . As increases, for this closer image position decreases (or stays relatively constant around ) while increases.
Example complete data:
| 60.0 | 32.0 | 28.0 | |
| 70.0 | 25.5 | 44.5 | |
| 80.0 | 23.0 | 57.0 | |
| 90.0 | 21.5 | 68.5 | |
| 100.0 | 20.5 | 79.5 |
Answer
All rows for and completed with and recorded to , showing the correct trend.
Complete table of u and v values to 0.1 cm
Walkthrough
For each value of from to :
- Position the screen at distance from the illuminated object.
- Move the convex lens until a sharp, focused image is formed.
- Record to the nearest and determine .
- Ensure all values in the table show consistent precision ( decimal place) and follow the expected physical trend where increases with .
Key Takeaways
- Data in practical tables must have consistent decimal precision matching the instrument resolution.
Common Mistakes
- Inconsistent number of decimal places in the table columns.
- Values of and that do not add up to the specified .
Things to Be Careful About
- Ensure the image is sharply focused before taking each reading.
Calculate for each value of and record your answers in Table 3.1. Give your values to 3 significant figures.
Working
Calculate for each row and round to 3 significant figures:
- For :
- For :
- For :
- For :
- For :
Completed Table 3.1:
Answer
| 60.0 | 32.0 | 28.0 | 896 |
| 70.0 | 25.5 | 44.5 | 1130 |
| 80.0 | 23.0 | 57.0 | 1310 |
| 90.0 | 21.5 | 68.5 | 1470 |
| 100.0 | 20.5 | 79.5 | 1630 |
Values of (u x v) calculated and correctly rounded to 3 significant figures in Table 3.1
Walkthrough
- Multiply by for each row of the table.
- Express each calculated value of to exactly 3 significant figures:
- (3 s.f.)
- (3 s.f.)
- (3 s.f.)
- (3 s.f.)
- (3 s.f.)
- Mark 1 is awarded for correct calculation of , and Mark 2 is awarded for all five values being correctly quoted to 3 significant figures.
Key Takeaways
- When the question specifies 3 significant figures, every single value in that column must adhere strictly to 3 s.f.
Common Mistakes
- Writing raw unrounded values from the calculator (e.g., ).
- Rounding to 2 or 4 significant figures instead of 3.
Things to Be Careful About
- For a 4-digit number like , rounding to 3 s.f. gives , not or .
Use the grid provided in Fig. 3.3 on page 11 to plot a graph of on the -axis against on the -axis.
You do not need to start your axes at the origin (0,0).
Draw the straight line of best fit.
Answer
- Axes: -axis labelled and -axis labelled .
- Scales: Linear, sensible scales occupying more than half the grid in both directions, not starting from (e.g., -axis from to , -axis from to ).
- Plotting: All 5 points plotted accurately to within half a small square.
- Line: A single, thin, straight line of best fit drawn through the points with an even balance of points on either side.
Graph plotted with correctly labelled axes, sensible non-origin scales, points plotted within half a small square, and a thin best-fit straight line.
Walkthrough
To earn all 4 marks on the graph:
- Axes and Labels (1 mark): Label the horizontal axis and the vertical axis . Both quantity and unit must be clearly stated.
- Scales (1 mark): Choose linear scales that make good use of the grid (filling of the grid area). The question explicitly advises not starting at . For example:
- -axis: per block (e.g. range )
- -axis: per block (e.g. range )
- Avoid awkward scales such as divisions of 3, 7, or 9.
- Plotting (1 mark): Plot each coordinate accurately with a small cross () or a sharp dot in a circle to within half a small square.
- Line of Best Fit (1 mark): Use a clear ruler to draw a single, thin, straight line that reflects the linear trend with points evenly balanced above and below the line.
Key Takeaways
- Graphs in practical exams must have clear labels with units, non-awkward scales using of the grid, precise plotting, and a thin best-fit line.
Common Mistakes
- Forcing the scale to start at , which compresses all the data into a tiny corner of the grid.
- Using thick, feathery, or double lines.
- Joining points dot-to-dot with straight segments instead of drawing a single best-fit line.
Things to Be Careful About
- Ensure points are plotted as neat crosses or encircled dots so they remain clearly visible after drawing the line.
The focal length of the lens is numerically equal to the gradient of the line.
Calculate the gradient of the line. Show all working and indicate on your graph in Fig. 3.3 the values you use.
= ______
Working
Choose two points on the best-fit line separated by more than half the line ():
At ,
At ,
Since :
Answer
15.0 cm (or value determined from candidate's graph gradient)
Walkthrough
- From the lens equation:
Rearranging gives:
Therefore, a plot of against produces a straight line through the origin with gradient equal to the focal length .
2. To determine the gradient:
- Draw a large triangle on the line of best fit such that the horizontal base (at least half the range of plotted points).
- Clearly indicate the coordinates or draw construction lines on the graph.
- Calculate .
- Record the value of with 2 or 3 significant figures and unit .
Key Takeaways
- Gradient calculations must use read-offs directly from the line of best fit, not from raw data points in the table.
- A large triangle spanning of the drawn line is mandatory to minimize read-off error.
Common Mistakes
- Using a tiny triangle with .
- Using data table points that do not lie on the best-fit line.
- Inverting the gradient as .
Things to Be Careful About
- Ensure coordinate values are read accurately from the chosen grid scales.
The lens manufacturer states that the focal length of the lens is .
Decide, with a calculation, whether your value of agrees with this statement and tick the box that shows your answer.
calculation:
[ ] my value for agrees with the manufacturer's statement
[ ] my value for does not agree with the manufacturer's statement.
Working
Acceptable range for :
Since the experimental value lies within this range (), the value agrees with the manufacturer's statement.
Answer
[x] my value for agrees with the manufacturer's statement
[ ] my value for does not agree with the manufacturer's statement.
Agrees (with calculation showing f is within 13.5 cm to 16.5 cm)
Walkthrough
- Calculate the acceptable range from the manufacturer's specification:
- Tolerance .
- Acceptable range .
- Alternatively, calculate the percentage difference between your experimental value and :
- Compare the experimental from part (c) with the limits:
- If (or percentage difference ), tick 'agrees'.
- If or , tick 'does not agree'.
Key Takeaways
- A statement of agreement between experimental and theoretical/nominal values requires an explicit numerical comparison against the given percentage tolerance.
Common Mistakes
- Ticking the box without showing any calculation.
- Comparing absolute values without calculating the tolerance range.
Things to Be Careful About
- Ensure the conclusion drawn exactly matches the calculation shown.
Plan an experiment to investigate how the thickness of a metal wire affects its resistance.
The resistance of a wire can be found using the equation:
The following apparatus is available:
- six lengths of metal wire, each of different thickness
- an ammeter
- a voltmeter
- a power supply
- several connecting leads
- a micrometer.
Other apparatus normally available in a school laboratory can also be used.
You are not required to do this experiment.
In your plan, you should:
- draw a circuit diagram to show how you will use the apparatus
- explain briefly how to carry out the investigation
- state the key variables to keep constant
- draw a table, with column headings, to show how to display readings (you are not required to enter any readings in the table)
- explain how to use these readings to reach a conclusion.
Circuit diagram
Power supply connected to the test wire, ammeter in series with the wire, voltmeter in parallel across the wire.
Method
- Measure the diameter (thickness) of each wire with the micrometer.
- Connect the circuit as shown.
- For each wire in turn, record the current from the ammeter and the p.d. across the wire from the voltmeter.
- Calculate the resistance of each wire using .
Variables to keep constant
- Length of each wire.
- Material of the wire.
Table
| Thickness / diameter of wire (mm) | Current (A) | p.d. across wire (V) | Resistance (Ω) |
|---|---|---|---|
Conclusion
Compare the resistances of the wires of different thicknesses, or plot a graph of resistance against thickness (diameter), to see whether the thickness affects the resistance.
See working — full plan with circuit diagram, method, control variables, table and conclusion.
Walkthrough
This is a planning question on Paper 3, so the six marks come from covering each of the five separate components listed in the question: circuit diagram (1 mark), method (2 marks), control variables (1 mark), table (1 mark) and conclusion (1 mark).
Circuit diagram (1 mark). The resistance is found from , so you must measure the p.d. across the wire and the current through it. The ammeter must be connected in series with the wire so that all the current through the wire passes through the ammeter. The voltmeter must be connected in parallel across the wire so that it measures the p.d. exactly across the wire, not across any other component. The power supply drives the current around the circuit.
Method (2 marks). The independent variable is the thickness of the wire. You measure each wire's thickness with the micrometer. Then, for each wire, you record the current and p.d. and calculate the resistance. This gives you a set of (thickness, resistance) pairs. The first mark is for measuring the thickness with the micrometer; the second is for taking the current and p.d. readings and calculating the resistance for each thickness.
Control variables (1 mark). For a fair test, only the thickness should change. The length of the wire and the material of the wire both affect resistance, so they must be kept the same for all six wires. The mark scheme accepts either one of these; naming both is safer.
Table (1 mark). The table needs columns for the thickness (or diameter) of the wire and the resistance, with units in the column headings. Including the current and p.d. columns shows how the readings are recorded before the resistance is calculated.
Conclusion (1 mark). You compare the resistances of the different thicknesses, or plot a graph of resistance against thickness (or diameter), to see whether the thickness affects the resistance. Either approach earns the mark.
Key Takeaways
- A planning question earns marks for each separately credited component: diagram, method, control variables, table and conclusion.
- The ammeter goes in series and the voltmeter in parallel — this is the standard arrangement for measuring resistance.
- A fair test keeps all variables constant except the one being changed.
- Tables need the quantity and its unit in the column heading.
- The conclusion must be tied to the readings — either comparing them or plotting a graph.
Common Mistakes
- Putting the ammeter in parallel or the voltmeter in series — this would give incorrect readings and is explicitly rejected.
- Not measuring the thickness with the micrometer — the micrometer is the given apparatus for this purpose.
- Forgetting to control the length or material of the wire — then you could not tell whether thickness alone caused the change in resistance.
- Table without units in the column headings — the mark requires units.
- Not explaining how the readings lead to a conclusion — the conclusion mark needs a method (comparison or graph).
Things to Be Careful About
- The control-variable mark is awarded for any one of length or material, but naming both is safer.
- The conclusion must be tied to the readings — either comparing them or plotting a graph of resistance against thickness (diameter).
- The table must have units in the column headings; the mark scheme explicitly requires this.
- The micrometer measures the diameter (thickness) of the wire — you should take a few readings along the wire and average them if the wire is not perfectly uniform.
- The p.d. and current readings should be taken with the circuit connected and stable — switch on, let the readings settle, then record.