Physics 5054/41 — May/June 2022
Cambridge O-Level · Alternative to Practical · worked solutions for every part, with the mark scheme
Topics Experimental Contexts · Analysis, Conclusions and Evaluation · Use of Techniques, Apparatus and Materials · Observations and Measurements · Planning Experiments and Investigations
A student investigates how the temperature of a volume of water changes as hotter water is added to it.
of water at is poured into a glass measuring cylinder.
Fig. 1.1 shows the measuring cylinder.
The measuring cylinder contains of water.
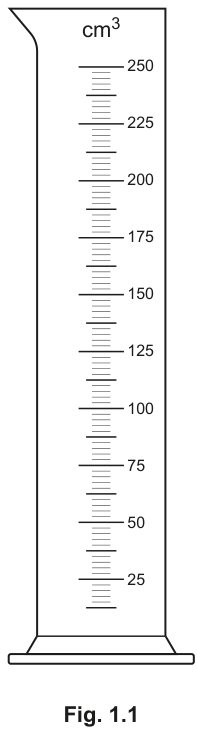
On Fig. 1.1, draw the level of the water, showing the meniscus.
The student pours of water from the measuring cylinder into a large beaker.
He then:
- uses a kettle to provide a constant supply of hot water
- adds of hot water at to the beaker
- stirs the mixture
- records the new temperature of the water in the beaker
- continues to add of hot water at a time, recording the new temperature for each addition, until a total of of hot water has been added.
The student ensures that the temperature of the water added each time is .
Suggest how this is done.
The student repeats the experiment and obtains three sets of results, as shown in Table 1.1.
Table 1.1
| total volume of hot water added | temperature | average temperature |
|---|---|---|
| 0 | 20 20 20 | 20 |
| 50 | 33 34 33 | 33 |
| 100 | 42 40 40 | 41 |
| 150 | 47 49 46 | |
| 200 | 51 52 51 | 51 |
| 250 | 53 54 53 | 53 |
| 300 | 54 55 54 | 54 |
Calculate the average temperature when total volume of hot water added .
Record, in Table 1.1, your answer to an appropriate number of significant figures.
On Fig. 1.2, plot a graph of on the y-axis against on the x-axis. Start both axes from the origin (0,0).
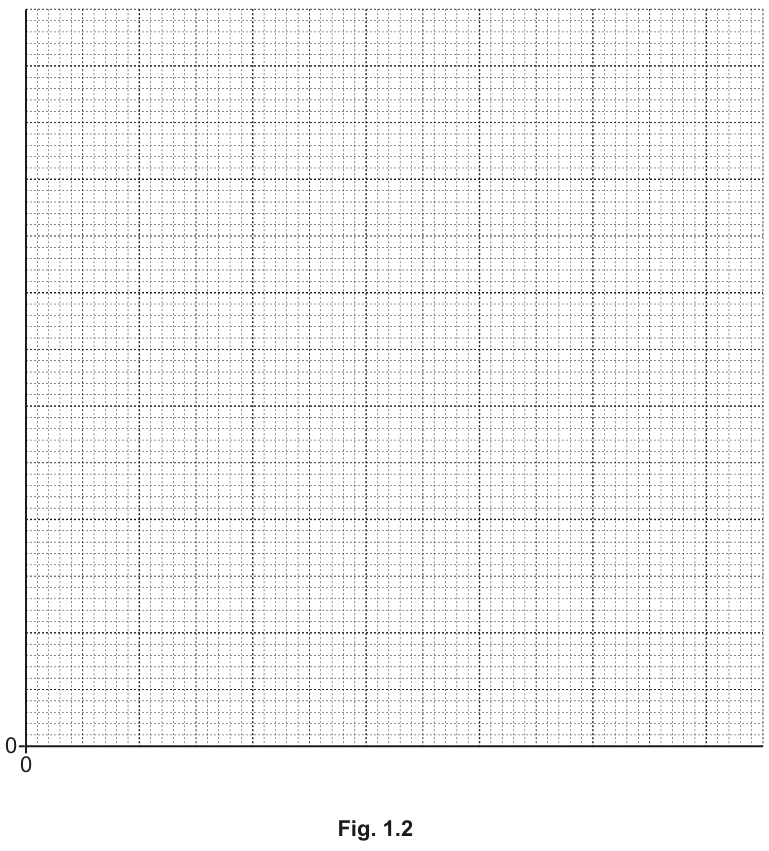
Draw a smooth curved line of best fit.
Your graph shows that is not directly proportional to .
Describe how your graph shows this and suggest why is not directly proportional to .
The student repeats the experiment with a layer of insulation around the beaker.
On your graph in Fig. 1.2, sketch a line to show the results with a layer of insulation around the beaker. Label this line with the letter A.
The rest of this paper
3 more questions- Q2Use of Techniques, Apparatus and Materials · Experimental Contexts · Analysis, Conclusions and Evaluation · Observations and Measurements7M
- Q3Experimental Contexts5M
- Q4Experimental Contexts · Planning Experiments and Investigations · Use of Techniques, Apparatus and Materials4M