Physics 5054/42 — October/November 2021
Cambridge O-Level · Alternative to Practical · worked solutions for every part, with the mark scheme
Topics Experimental Contexts · Analysis, Conclusions and Evaluation · Use of Techniques, Apparatus and Materials · Observations and Measurements
A student measures a value for the specific latent heat of vaporisation of water.
The student:
- pours 100 g of water at room temperature into a beaker placed on a top-pan balance
- connects an immersion heater into a circuit with a suitable power source, an ammeter and a switch
- places the immersion heater into the water
- reads and records the mass of the beaker and water.
The apparatus is shown in Fig. 1.1.
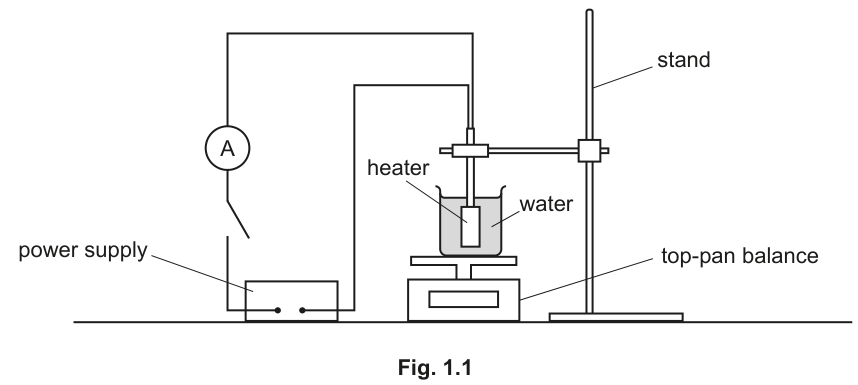
On Fig. 1.1, draw a voltmeter connected to measure the potential difference across the heater.
Answer
A voltmeter (a circle containing the letter 'V') connected in parallel across the two terminals/leads of the immersion heater.
Voltmeter connected in parallel across the immersion heater
Walkthrough
To measure the potential difference across an electrical component (the immersion heater), a voltmeter must always be connected in parallel with it.
On the diagram, this is drawn as a circle with the letter inside, connected by two lead lines to the two wires/terminals going into the top of the immersion heater.
Key Takeaways
- Voltmeters are connected in parallel with the component whose potential difference is being measured.
- Ammeters are connected in series in the main loop to measure the current flowing through the circuit.
Common Mistakes
- Connecting the voltmeter in series with the heater or power supply.
- Drawing the voltmeter connected across the entire circuit or across the ammeter instead of specifically across the heater.
Things to Be Careful About
- Ensure the connecting lines clearly touch the two leads/terminals on either side of the immersion heater.
The student closes the switch.
The scales of the voltmeter and ammeter are shown in Fig. 1.2.
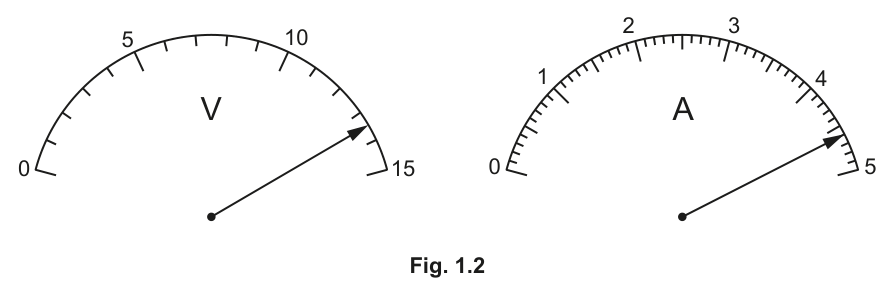
Record the readings from the meter scales.
reading on voltmeter = ______
reading on ammeter = ______
Answer
reading on voltmeter =
reading on ammeter =
reading on voltmeter V = 13.5 V; reading on ammeter I = 4.60 A
Walkthrough
-
Voltmeter Scale:
- The scale ranges from to .
- Between and , there are 10 small divisions, so each small division represents:
- The pointer is 7 divisions past :
-
Ammeter Scale:
- The scale ranges from to .
- Between and , there are 10 small divisions, so each small division represents:
- The pointer is 6 divisions past :
Key Takeaways
- Always determine the value of one small division on an analogue scale before reading.
- State values clearly to the precision indicated by the tick marks.
Common Mistakes
- Miscounting the divisions on the voltmeter (e.g. assuming each division is or ).
- Reading the ammeter as or by not counting divisions from 4 carefully.
Things to Be Careful About
- Ensure you read directly along the line of the pointer to avoid parallax error.
The student:
- waits a few minutes until the water starts to boil
- records the reading on the top-pan balance when the water starts to boil and starts a stopclock
- records the reading on the top-pan balance every minute for 6 minutes
- opens the switch.
The student's results are shown in Fig. 1.3 and in Table 1.1.
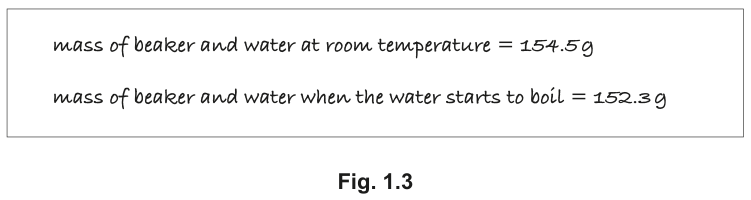
Table 1.1
| time / minutes | mass of beaker and water / | mass of water boiled away / |
|---|---|---|
| 0 | 152.3 | 0 |
| 1.0 | 150.9 | 1.4 |
| 2.0 | 149.1 | 3.2 |
| 3.0 | 147.4 | |
| 4.0 | 145.6 | 6.7 |
| 5.0 | 144.2 | 8.1 |
| 6.0 | 142.6 | 9.7 |
Complete Table 1.1 by filling in the value of the mass of water boiled away at time .
Working
Answer
4.9
Walkthrough
The mass of water boiled away at any time is the initial mass of the beaker and water when boiling begins () minus the mass recorded at time :
At , .
At , the reading is .
Key Takeaways
- The boiled-off mass is found by subtracting the current reading from the initial reading at .
- Maintain consistent decimal places with the rest of the table ( decimal place).
Common Mistakes
- Subtracting from the room-temperature mass () instead of the boiling-start mass at ().
Things to Be Careful About
- Ensure the table entry matches the decimal place precision of the other values in the column.
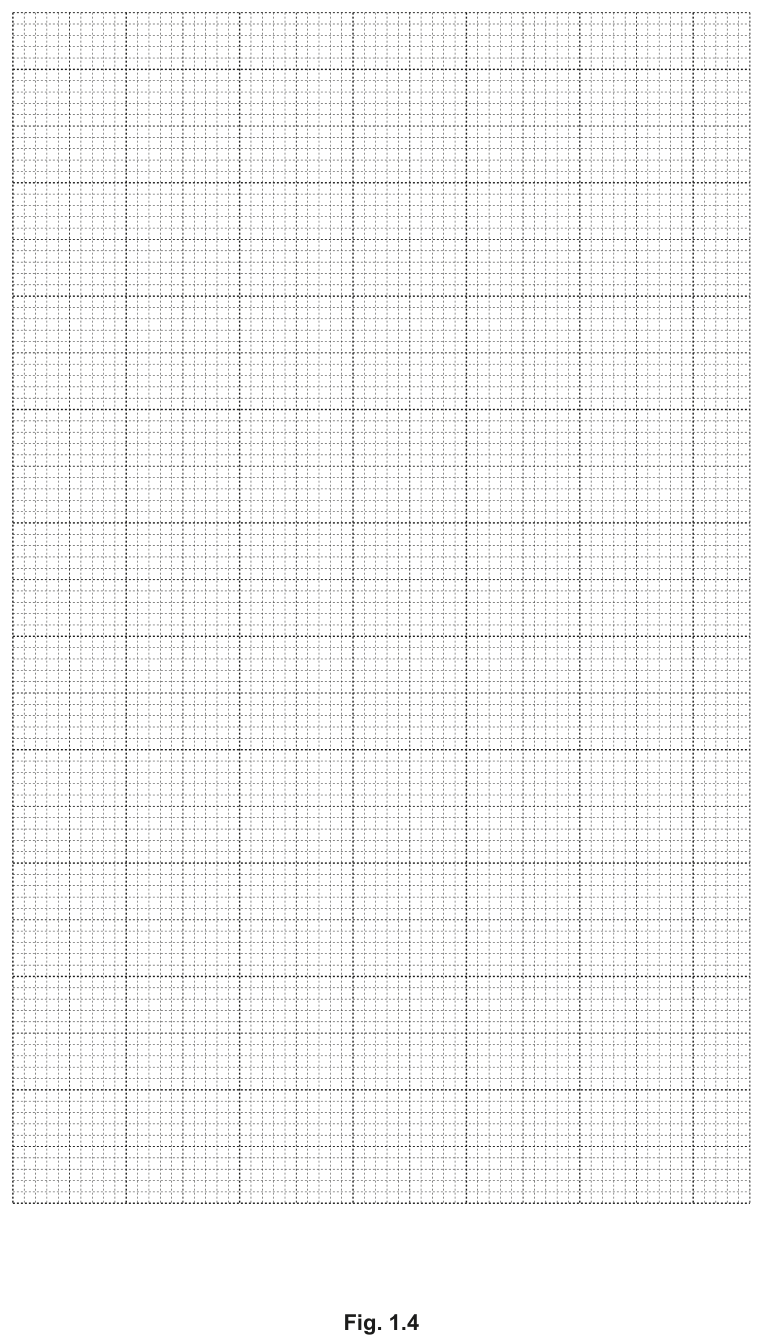
On the grid provided in Fig. 1.4 on page 5, plot a graph of mass on the -axis against time on the -axis.
Draw the best-fit straight line.
Answer
- Axes: -axis labelled 'mass / ' and -axis labelled 'time / '. Both start at .
- Scales: -axis: (running 0 to at least 6.0 minutes); -axis: or (running 0 to at least 10.0 g).
- Plotting: All points , , , , , , plotted accurately to within half a small square.
- Line: A single thin, smooth straight line of best fit drawn passing close to all plotted points and through the origin.
Graph of mass m / g against time t / minutes plotted with a straight line of best fit
Walkthrough
-
Label the Axes:
- Vertical axis (-axis):
- Horizontal axis (-axis):
-
Choose Scales:
- The scales must be linear, convenient to read (e.g. multiples of 1, 2, or 5), and occupy more than half of the provided grid in both directions.
- -axis: 0 to . A suitable scale is 2 major grid squares () .
- -axis: 0 to . A suitable scale is 2 major grid squares () (i.e. ).
-
Plot Points:
- Each point must be plotted with a small neat cross () or a dot with a small circle around it, accurate to within of a small square.
-
Draw Best-Fit Line:
- Use a long clear ruler.
- Draw a single, sharp, continuous straight line that balances the points equally on either side.
Key Takeaways
- Scales should make plotting and reading easy (avoid scales based on 3s, 7s, etc.).
- Graphs in 5054 should fill more than half the grid along both axes.
- A best-fit line must be thin, continuous, and have an even balance of points above and below.
Common Mistakes
- Inverting the axes ( on -axis, on -axis).
- Forgetting units in axis labels.
- Non-linear scales or awkward scales (like 3 squares = 1 unit).
- Drawing 'dot-to-dot' lines instead of a single best-fit line.
Things to Be Careful About
- Keep pencil lines sharp. A thick line can lose the best-fit line mark.
Determine the gradient of your line.
Show your working. Indicate on the graph the values you use.
= ______
Working
Using coordinates from the line of best fit with , for example and :
Answer
1.62
Walkthrough
-
Select Coordinates:
- Choose two points on the best-fit straight line that are far apart (the change in , , must be at least half the length of the line, so ).
- Do not simply pick table data points unless they lie exactly on the line.
-
Indicate Working on the Graph:
- Draw a large right-angled triangle or mark the chosen coordinate values clearly on the grid.
-
Calculate Gradient:
For example, using and :
The accepted range in the mark scheme is to .
Key Takeaways
- Always use a large triangle spanning at least half the plotted data line to minimise reading uncertainty.
- Use points on the drawn line, not unaligned data points from the table.
Common Mistakes
- Using points separated by less than half the line ().
- Dividing a single pair of table coordinates (e.g. ) without showing coordinates on the line.
- Inverting the gradient formula as .
Things to Be Careful About
- Ensure values used are clearly indicated on the graph and match the working shown.
Use your readings from (b) to calculate the thermal energy supplied to the water in 1.0 minute using the equation:
where .
= ______
Working
Answer
(or )
3726 J
Walkthrough
We are given the formula:
where:
- (from part (b))
- (from part (b))
- (the time in seconds for )
Substitute these values into the equation:
To 2 or 3 significant figures, this can be written as or (or left as ).
Key Takeaways
- Electrical energy transferred is calculated using .
- Time must always be in seconds when calculating energy in joules ().
Common Mistakes
- Using instead of converting to .
- Using incorrect values carried from part (b).
Things to Be Careful About
- Check your arithmetic and verify that the units given on the answer line are joules ().
Use your answers from (d) and (e)(i) to calculate a value for the specific latent heat of vaporisation of water using the equation:
= ______
Working
Answer
2300 J / g
Walkthrough
Using the given equation:
where:
- (energy supplied per minute from (e)(i))
- (mass boiled away per minute from (d))
Substitute the values:
(Note: error carried forward is allowed for candidate's own values of and ).
Key Takeaways
- Since is energy supplied in and is the mass evaporated in , their ratio directly gives the specific latent heat of vaporisation in .
Common Mistakes
- Inverting the division ().
- Forgetting to carry forward values consistently from (d) and (e)(i).
Things to Be Careful About
- Note the units requested are , so no conversion of mass from grams to kilograms is required.
The student's results in (c) show that the mass of the beaker and water just as the water starts to boil is less than the mass of the beaker and water at room temperature.
Explain the difference in mass.
Answer
Water evaporates (as its temperature rises to boiling point).
Water evaporates as its temperature increases
Walkthrough
Between room temperature and (the boiling point), thermal energy is supplied to the water. During this heating period before boiling starts, water molecules at the surface gain enough kinetic energy to escape into the air as vapour — this process is evaporation.
Because water has evaporated into the air during the warm-up period, the mass of water remaining just as boiling begins () is less than the mass at room temperature ().
Key Takeaways
- Evaporation occurs from the surface of a liquid at any temperature below the boiling point.
- Boiling occurs throughout the liquid at a fixed temperature (the boiling point).
Common Mistakes
- Stating that water is 'boiling' before it reaches the boiling point.
- Vague statements like 'mass is lost to heat' or 'water is consumed'.
Things to Be Careful About
- Use the precise physical term: evaporation / evaporates.
Thermal energy is lost by conduction through the sides of the beaker during the experiment. This means that the value determined for in this experiment is greater than the accepted value.
Explain how the loss of energy through the sides of the beaker causes this difference.
Answer
Not all electrical energy supplied goes into boiling the water, so less mass of water is boiled away in a given time (the gradient is smaller than it should be). In the equation , a smaller denominator results in a larger calculated value of .
Thermal energy lost to the surroundings means less mass evaporates (G is smaller), making the calculated Lv larger
Walkthrough
-
Where does the energy go?
- The calculated energy assumes that all electrical energy supplied is transferred to boiling the water.
- In reality, some thermal energy is lost to the surroundings through the walls and base of the beaker.
-
Effect on the mass evaporated ():
- Because some energy is lost, the energy actually available for boiling the water is less than .
- Consequently, less mass evaporates per minute than would evaporate in an ideal system, making the gradient (rate of mass loss) smaller.
-
Effect on calculated :
- Since , dividing the full supplied energy by a smaller gradient yields a value of that is greater than the true accepted value.
Key Takeaways
- Energy losses to the surroundings reduce the useful energy converted, leading to an overestimate in specific latent heat calculations ().
Common Mistakes
- Claiming that energy loss causes to be smaller (we calculate from , which does not change).
- Giving a vague explanation without linking the energy loss to the smaller mass boiled away or the formula .
Things to Be Careful About
- Be clear that the measured mass evaporated () is smaller than expected for the amount of electrical energy supplied.
State how the loss of thermal energy can be reduced.
Answer
Insulate (lag) the sides and bottom of the beaker (or put a lid on the beaker).
Insulate (lag) the beaker
Walkthrough
To minimise conductive and convective thermal energy loss from the beaker to the surroundings:
- Insulate / lag the sides and bottom of the beaker using a poor thermal conductor (such as cotton wool, polystyrene, or mineral wool).
- Alternatively, use a lid with a hole for the heater to reduce heat loss from the top (though steam must still be allowed to escape freely).
Key Takeaways
- Thermal insulation (lagging) reduces heat transfer by conduction and convection to the surroundings in thermal physics experiments.
Common Mistakes
- Vague answers such as 'do the experiment faster' or 'be more careful'.
- Suggesting sealing the beaker completely with an airtight lid (which would trap steam and prevent mass from escaping, altering the boiling experiment).
Things to Be Careful About
- Use accepted terminology: 'insulate the beaker' or 'lag the beaker'.
The rest of this paper
3 more questions- Q2Experimental Contexts · Analysis, Conclusions and Evaluation · Observations and Measurements5M
- Q3Experimental Contexts · Use of Techniques, Apparatus and Materials · Observations and Measurements · Analysis, Conclusions and Evaluation6M
- Q4Use of Techniques, Apparatus and Materials · Experimental Contexts · Analysis, Conclusions and Evaluation3M