Physics 5054/41 — October/November 2021
Cambridge O-Level · Alternative to Practical · worked solutions for every part, with the mark scheme
Topics Experimental Contexts · Observations and Measurements · Analysis, Conclusions and Evaluation · Use of Techniques, Apparatus and Materials · Planning Experiments and Investigations
A student investigates how the period of a pendulum depends upon its length.
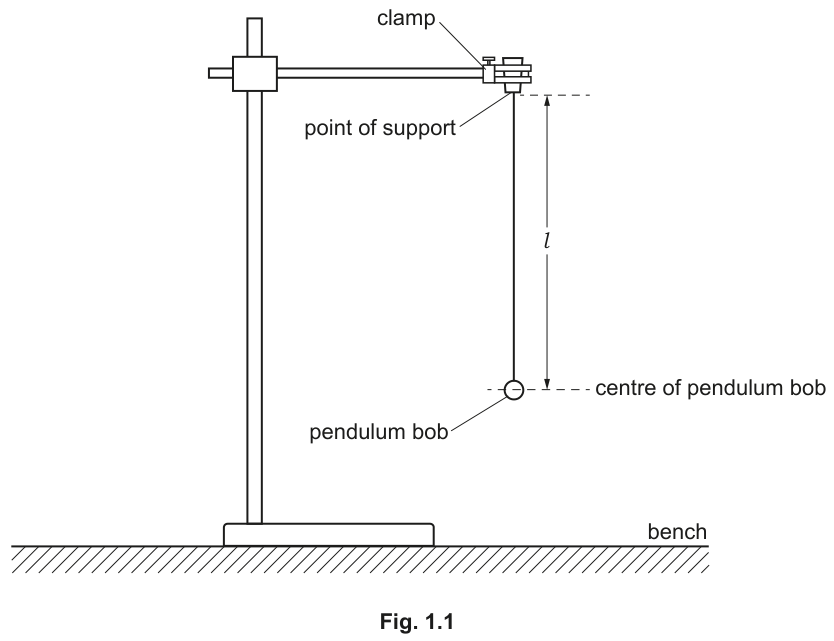
The student:
- arranges the apparatus, as shown in Fig. 1.1
- clamps the string of the pendulum in position.
The length of the pendulum is the distance from the centre of the pendulum bob to the point of support.
Measure the distance on Fig. 1.1 to the nearest millimetre. Record your result.
= ______
Fig. 1.1 is drawn to a scale of one-eighth of the full size.
Determine the actual length of the pendulum from the point of support to the centre of the pendulum bob.
= ______
The period is the time taken for one complete oscillation of the pendulum.
One complete oscillation is one complete swing, e.g. from the middle to one side, through the middle to the other side and back to the middle.
The student:
- adjusts the length of the thread until is 15.0 cm
- gives the bob a small sideways displacement and releases it so that it oscillates
- records the time for 10 complete oscillations
- repeats this procedure two more times.
The following values of the time for 10 complete oscillations are recorded:
7.4 s 7.8 s 7.7 s
Calculate , the average value of the time for 10 complete oscillations. Give your answer to 2 significant figures.
= ______
The student repeats the procedure in (b)(i) for length , , and . The results are shown in Table 1.1.
Complete Table 1.1 using your answer from (b)(i). You will need to calculate and .
Table 1.1
| 15.0 | |||
| 20.0 | 8.9 | 0.89 | 0.79 |
| 25.0 | 9.9 | 0.99 | 0.98 |
| 30.0 | 10.8 | 1.08 | 1.17 |
| 35.0 | 11.8 | 1.18 | 1.39 |
Explain why the student measures the time for 10 complete oscillations, rather than for 1 complete oscillation.
On the grid in Fig. 1.2, plot a graph of (-axis) against (-axis). Start your axes from the origin (0,0). Draw the straight line of best fit.
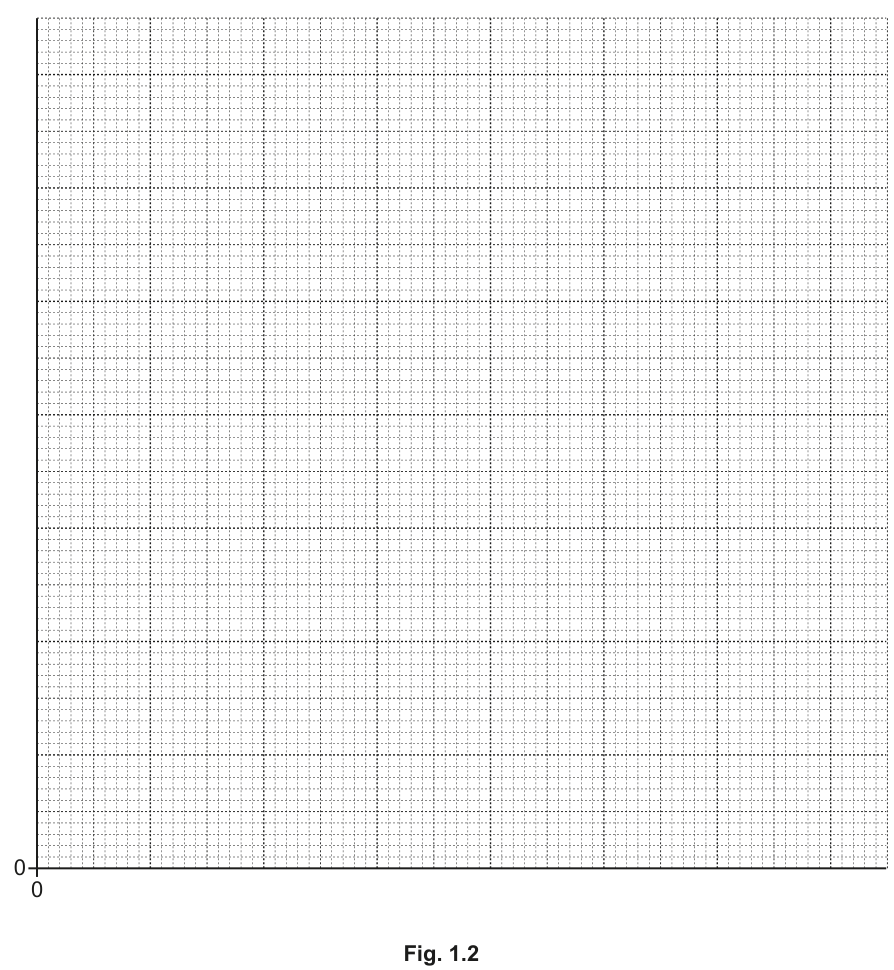
Determine the gradient of your line.
Show your working and indicate on the graph the values you use.
= ______
Theory suggests that the gravitational field strength is equal to:
Use this equation and your value of in (b)(v) to calculate a value for .
= ______
Compare the value of you obtained in (b)(vi) with the accepted value of .
State whether the two values agree with each other and justify your answer.
The rest of this paper
3 more questions- Q2Observations and Measurements · Analysis, Conclusions and Evaluation5M
- Q3Experimental Contexts · Observations and Measurements · Use of Techniques, Apparatus and Materials · Analysis, Conclusions and Evaluation6M
- Q4Experimental Contexts · Planning Experiments and Investigations5M