Physics 5054/42 — October/November 2019
Cambridge O-Level · Alternative to Practical · worked solutions for every part, with the mark scheme
Topics Experimental Contexts · Observations and Measurements · Analysis, Conclusions and Evaluation · Use of Techniques, Apparatus and Materials · Planning Experiments and Investigations
A student in a laboratory investigates how the length of a spring varies when different loads are added to it.
He sets up a spring in a clamp with a load of attached to its lower end, as shown in Fig. 1.1.
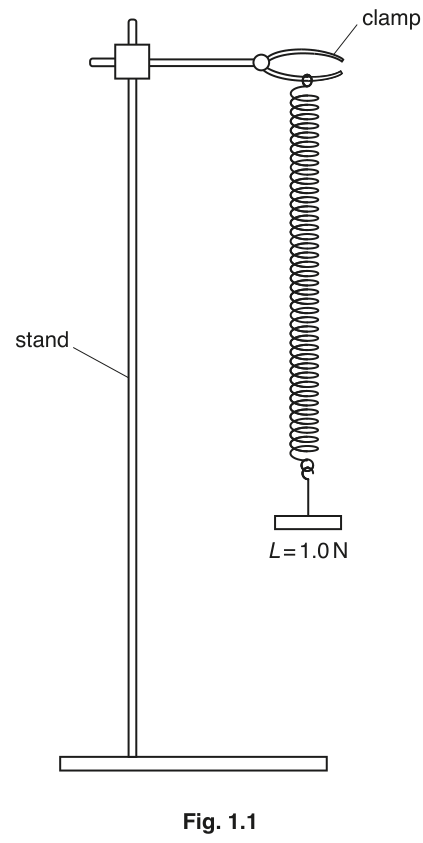
Measure the length of the spring shown in the diagram in Fig. 1.1. Do not include the loops at each end of the spring in your measurement.
Record your answer in Table 1.1.
On the diagram in Fig. 1.1, draw a ruler in the correct position for the student to measure the length in the laboratory.
The student determines as accurately as possible the reading on the ruler at the bottom of the spring.
On Fig. 1.1, mark with an X the position of the student's eye.
The student varies the load and takes a series of measurements of and . His results are shown in Table 1.1.
Table 1.1
| 1.0 | |
| 3.0 | 130 |
| 5.0 | 198 |
| 2.0 | 100 |
| 4.0 | 163 |
State one way to improve the table of results.
______
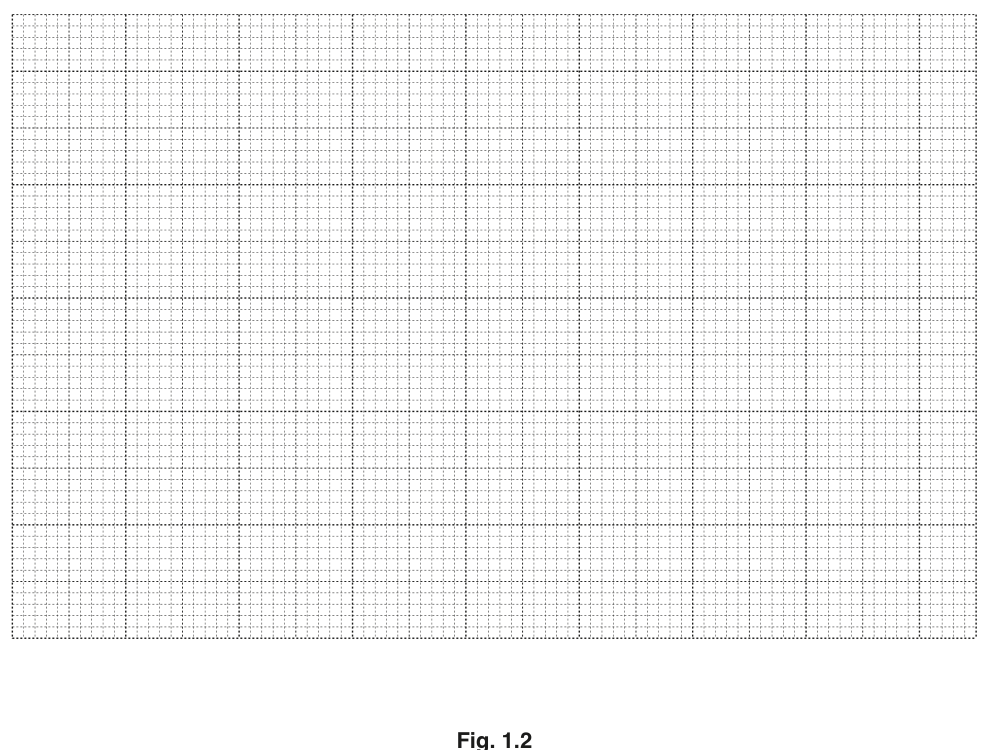
On the grid in Fig. 1.2, plot a graph of (-axis) against (-axis). Start both axes from the origin . Draw the best-fit straight line.
State whether is directly proportional to .
Explain your answer.
______
Use your graph to determine the length of the unstretched spring.
Show on your graph how you did this.
= ______
Using your graph in Fig. 1.2, determine the extension of the spring for a load of .
= ______
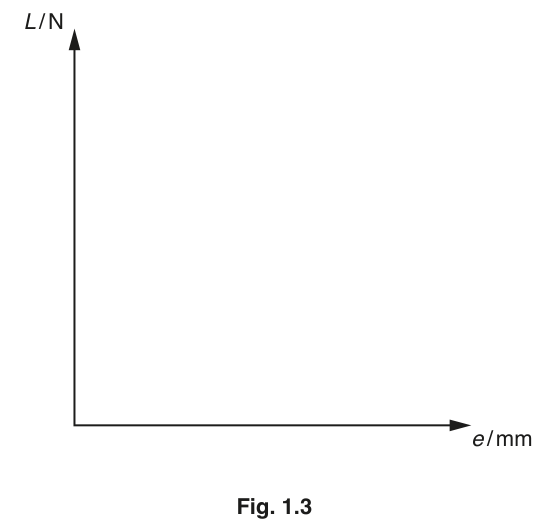
On the axes in Fig. 1.3, sketch a graph of against .
The gradient of your graph in Fig. 1.2 measures the force constant of the spring. The greater the force constant, the harder it is to stretch the spring.
A second spring has the same unstretched length but a greater force constant.
Using the same axes, draw on Fig. 1.2 a line to show how the length of this second spring changes as loads are added to it.
Label this line S.
The rest of this paper
3 more questions- Q2Experimental Contexts · Observations and Measurements · Analysis, Conclusions and Evaluation6M
- Q3Observations and Measurements · Experimental Contexts · Analysis, Conclusions and Evaluation · Use of Techniques, Apparatus and Materials5M
- Q4Experimental Contexts4M