Physics 5054/42 — May/June 2016
Cambridge O-Level · Alternative to Practical · worked solutions for every part, with the mark scheme
Topics Use of Techniques, Apparatus and Materials · Experimental Contexts · Observations and Measurements · Analysis, Conclusions and Evaluation · Planning Experiments and Investigations
A student investigates the oscillations of a metre rule.
The student starts by supporting one end of a heavy rod using a stand, boss and clamp.
Fig. 1.1 shows how he assembled the apparatus.
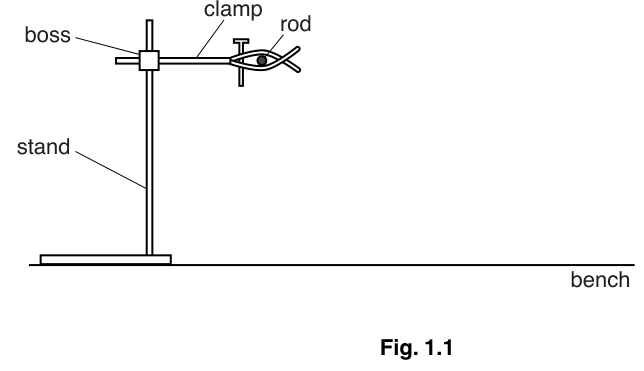
Explain why this is not the best way to assemble one stand, boss and clamp to support a heavy rod.
Answer
The clamp is at the end of the rod, so the heavy rod extending to the right creates a large turning effect (moment) about the boss. This makes the stand likely to topple, tilt or become unbalanced to the right.
The heavy rod creates a large moment about the boss, making the stand likely to topple or tilt to the right.
Walkthrough
The question asks why the assembly in Fig. 1.1 is not the best way to support a heavy rod. In Fig. 1.1, the clamp is attached near the top of the boss, and the heavy rod extends horizontally to the right. This arrangement acts like a lever: the weight of the heavy rod acts at a large distance from the pivot point (the boss), creating a large clockwise moment. This large moment will cause the stand to tilt, bend, or topple to the right. A safer assembly would have the rod extending in the opposite direction, or the clamp positioned closer to the stand to reduce the moment arm.
Key Takeaways
When setting up apparatus with stands and clamps, consider the centre of mass and the turning effects (moments) of any heavy loads. Loads extending away from the support create instability.
Common Mistakes
- Saying "it is heavy" without explaining the mechanism (the large moment/turning effect).
- Saying "it will break" instead of "topple" or "tilt".
Things to Be Careful About
- Use precise language: "topple", "tilt", "become unbalanced", or mention the "turning effect" or "moment". Avoid vague terms like "it will fall" without explanation.
In the space to the right of Fig. 1.1, sketch a better way of assembling this apparatus.
Answer
Sketch showing the rod turned around so it extends to the left, over the base of the stand.
Walkthrough
To make the assembly stable, the heavy rod should extend over the base of the stand rather than away from it. This can be achieved by turning the rod around the other way, so the clamp is still at the top but the rod now extends to the left, over the heavy base. This places the centre of mass of the rod over the base, preventing it from toppling.
Key Takeaways
A stable setup places the load over the base of support. Turning the rod around achieves this.
Common Mistakes
- Drawing the rod extending to the right still.
- Changing the position of the boss to the bottom of the stand (the mark scheme specifically accepts turning the rod around).
Things to Be Careful About
- Ensure the sketch is clear and shows the rod extending over the base. The mark scheme specifically looks for "rod turned around the other way".
Two clamps are used to support the rod horizontally, about above the bench, as shown in Fig. 1.2.
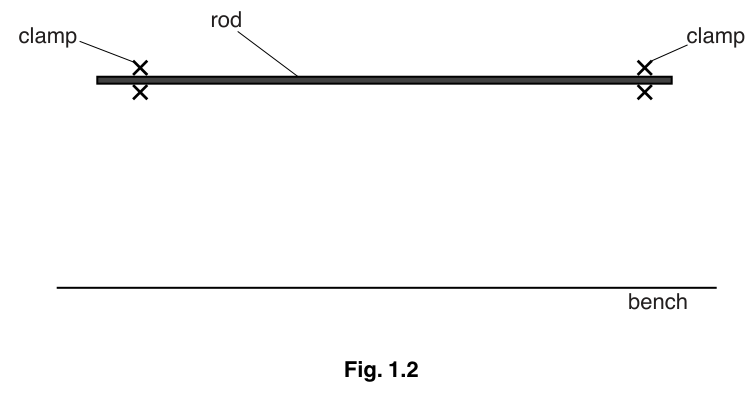
The student is given a metre rule and two set-squares to check that the rod is horizontal.
Draw on Fig. 1.2 to show how the apparatus is used.
Answer
Draw a vertical rule (or set-square edge) standing on the bench at two different points along the rod, with the top of the rule touching the underside of the rod.
Walkthrough
To check if the rod is horizontal, the student can measure the height of the rod above the bench at two different points. This is done by placing a rule or the edge of a set-square vertically on the bench, with its top edge touching the underside of the rod. This is repeated at two different positions along the rod. If the rod is horizontal, the height measured at both points will be the same.
Key Takeaways
Set-squares and rules can be used as vertical references to check horizontal alignment by measuring the gap or height at multiple points.
Common Mistakes
- Drawing the set-squares on top of the rod instead of underneath.
- Not showing the set-squares or rule standing vertically on the bench.
Things to Be Careful About
- The mark scheme requires the rule/set-square to be vertical and correctly used (touching the bench and the rod). Ensure the drawing clearly shows this.
Explain how he can tell that the rod is horizontal.
Answer
The height (or distance) above the bench is the same at both places where the set-squares (or rule) are placed.
The height above the bench is the same at two places.
Walkthrough
If the rod is horizontal, its distance from the horizontal bench must be constant. Therefore, when the student measures the height from the bench to the underside of the rod at two different points using the set-squares, the readings will be identical. If the readings differ, the rod is not horizontal.
Key Takeaways
A horizontal line is at a constant height above a horizontal reference surface.
Common Mistakes
- Saying "the rule is parallel to the bench" without referencing the measurement.
- Not mentioning that the heights must be the same at two places.
Things to Be Careful About
- Use the word "height" or "distance" above the bench. Ensure it is clear that two measurements are being compared.
The student suspends the metre rule from the rod using two pieces of thread of equal length.
A half-metre rule is placed on the bench, under the metre rule, so that the end A of the metre rule is above the end of the half-metre rule, as shown in Fig. 1.3.
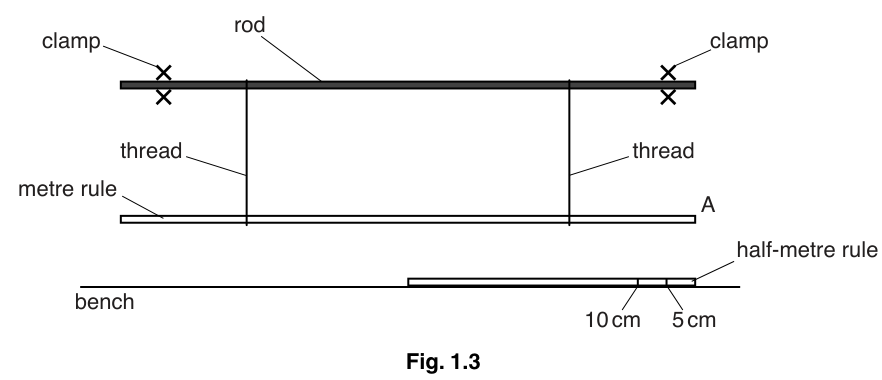
Describe how the student can check that the end A of the metre rule is exactly above the end of the half-metre rule.
Answer
Use a vertical ruler, set-square, or plumb line hanging from end A of the metre rule down to the half-metre rule to check that end A is directly above the 0 cm mark.
Use a vertical ruler, set-square, or plumb line to check alignment.
Walkthrough
To ensure end A of the metre rule is exactly above the 0 cm end of the half-metre rule, a vertical reference line is needed. The student can hang a plumb line from end A, or place a set-square or ruler vertically from end A down to the half-metre rule. If end A is directly above the 0 cm mark, the vertical tool will align with the 0 cm mark on the half-metre rule.
Key Takeaways
Vertical alignment can be checked using a plumb line, set-square, or ruler placed vertically from the upper point to the lower scale.
Common Mistakes
- Suggesting to look from the side (parallax error).
- Not specifying a vertical tool.
Things to Be Careful About
- The mark scheme accepts "vertical ruler", "set square", or "plumb line". Ensure the method establishes a vertical line.
The metre rule is moved to the left until the end A is above the mark on the half-metre rule. It is then released. As the metre rule swings, the amplitude of the swing decreases.
The student counts the number of swings until end A no longer passes the mark on the half-metre rule. He repeats this several times and his results are shown below.
Calculate , the average value of .
Give your answer to 2 significant figures.
= ______
Working
Rounding to 2 significant figures:
Answer
53
53
Walkthrough
The student counts the number of swings until the amplitude decreases enough that end A no longer passes the 5 cm mark. Five repeated measurements are given: 53, 55, 52, 51, 53. To find the average , sum these values and divide by the number of measurements (5).
Sum = 53 + 55 + 52 + 51 + 53 = 264.
Average = 264 / 5 = 52.8.
The question asks for the answer to 2 significant figures. 52.8 rounded to 2 significant figures is 53.
Key Takeaways
Always calculate the average of repeated measurements to reduce random errors. Pay attention to the required number of significant figures.
Common Mistakes
- Forgetting to divide by the number of measurements.
- Rounding 52.8 to 52 or 530.
- Not rounding to 2 significant figures as requested.
Things to Be Careful About
- The mark scheme gives "53 cao" (correct answer only), so 52.8 would not score if 2 sig figs are required. Ensure the final answer is exactly 53.
The student is given one square piece of card of side . He attaches the centre of the card to the end A of the metre rule with a small piece of Blu-tack, as shown in Fig. 1.4.
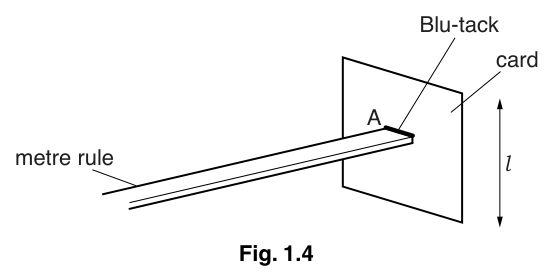
The value of is .
The student repeats the experiment in (c) to obtain a value for .
He then cuts the card to make the square smaller and repeats the experiment with smaller values of . Fig. 1.5 shows the student's results.
Fig. 1.5
| 19.0 | 3 |
| 15.0 | 6 |
| 11.0 | 12 |
| 7.0 | 22 |
| 3.0 | 35 |
| 0 |
Complete Fig. 1.5 by recording your value for from (c)(ii) for .
Answer
| 19.0 | 3 |
| 15.0 | 6 |
| 11.0 | 12 |
| 7.0 | 22 |
| 3.0 | 35 |
| 0 | 53 |
53
Walkthrough
The value of calculated in part (c)(ii) for (no card attached) is 53. This value is recorded in the last row of the table in Fig. 1.5.
Key Takeaways
Results from calculations should be correctly transcribed into results tables.
Common Mistakes
- Writing 52.8 instead of 53.
- Leaving the cell blank.
Things to Be Careful About
- The table already has the unit in the column header (), so just write the number 53.
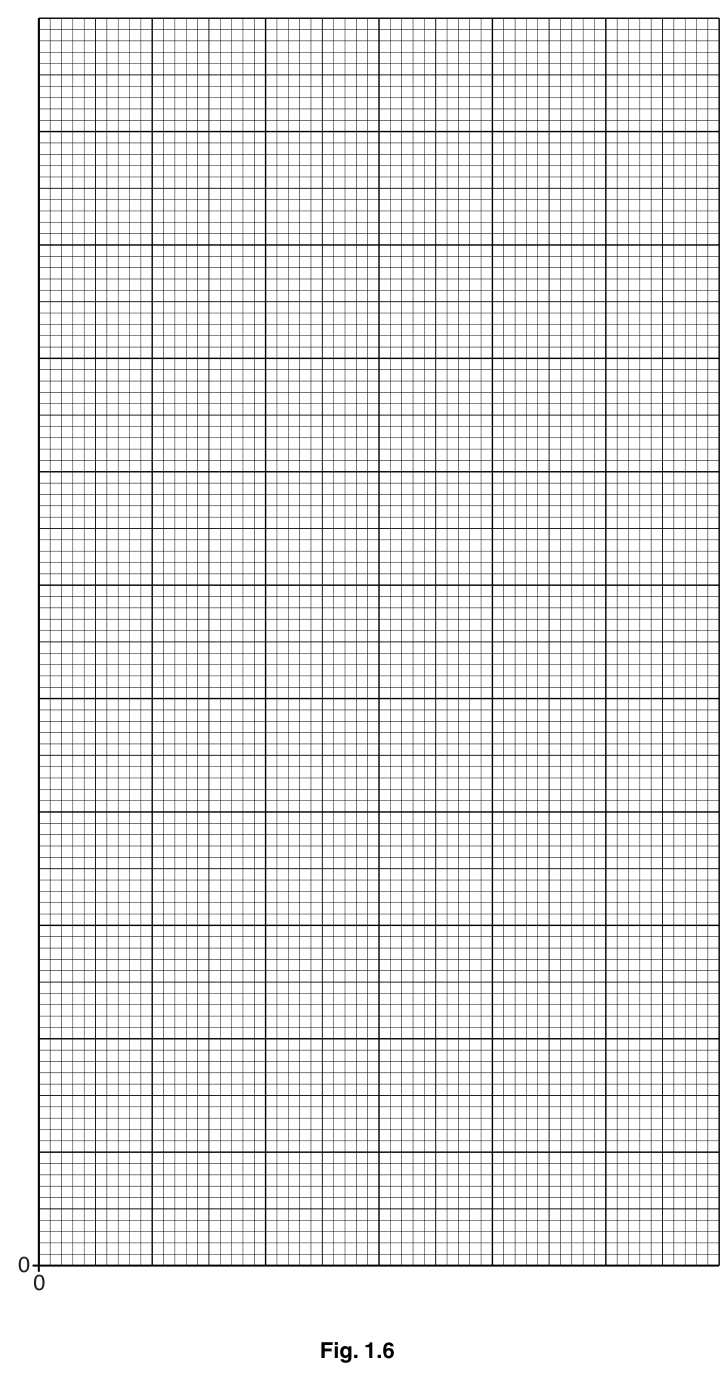
On Fig. 1.6, plot the graph of on the -axis against on the -axis.
Start your axes from (0,0). Draw the smooth curve of best fit.
Answer
Graph plotted with on x-axis (0 to 40), on y-axis (0 to 20), points plotted accurately, smooth curve of best fit drawn.
Walkthrough
The graph plots (y-axis) against (x-axis). The data points are:
(3, 19.0), (6, 15.0), (12, 11.0), (22, 7.0), (35, 3.0), (53, 0).
- Axes: x-axis is (no unit, or unitless count), y-axis is / cm. Start both axes at (0,0).
- Scales: x-axis needs to go up to at least 53 (e.g., 0 to 60, with 10 small squares = 10 units). y-axis needs to go up to at least 19 (e.g., 0 to 20, with 10 small squares = 2 cm).
- Plotting: Plot all 6 points accurately. Points should be within half a small square.
- Curve: Draw a smooth curve of best fit. The curve should start at (53, 0) on the x-axis and curve upwards to the left, passing near or through all other points. It is not a straight line.
Key Takeaways
When plotting graphs, ensure axes are correctly labelled with quantity and unit, scales are linear and use at least half the grid, points are plotted accurately, and a smooth curve of best fit is drawn (not a line of best fit for non-linear data).
Common Mistakes
- Swapping the x and y axes ( on x-axis, on y-axis).
- Using awkward scales (e.g., 0 to 50 with 10 small squares = 5 units).
- Drawing a straight line through the points instead of a smooth curve.
- Plotting points inaccurately.
Things to Be Careful About
- The mark scheme awards 1 mark for axes labelled correctly (quantity on both, unit on y-axis only, correct way round).
- 1 mark for scales linear, not awkward, starting from (0,0).
- 1 mark for points plotted accurately.
- 1 mark for smooth best fit curve.
- Ensure the curve is smooth and does not necessarily pass through every point, but represents the trend.
The graph shows that as decreases, increases.
Two quantities and are inversely proportional if they obey the equation
where is a constant.
By taking two pairs of values from the graph, show that is not inversely proportional to .
Working
If is inversely proportional to , then (a constant) for all pairs of values.
Using values from the table/graph:
For , :
For , :
Since , the product is not constant.
Answer
is not constant (e.g., and ), so is not inversely proportional to .
The product is not constant (e.g., 57 and 105), so they are not inversely proportional.
Walkthrough
Two quantities and are inversely proportional if , which means (a constant). To show that is not inversely proportional to , we calculate the product for at least two pairs of values and show that they are not equal.
Using values from the table:
- Pair 1: cm, . Product = .
- Pair 2: cm, . Product = .
Since , the product is not constant, and therefore is not inversely proportional to .
Key Takeaways
To test for inverse proportionality, check if the product of the two variables is constant across different data points.
Common Mistakes
- Calculating the ratio instead of the product.
- Using only one pair of values (need at least two to compare).
- Making arithmetic errors in the multiplication.
Things to Be Careful About
- The mark scheme awards 1 mark for seeing for one pair, and 1 mark for two correct values calculated and not equal. Ensure you show the calculation for at least two pairs.
Suggest why the student starts with and then reduces , rather than starts with and then increases .
Answer
Starting with cm and reducing means less card is used overall. The student can use just one piece of card for the entire experiment, cutting it smaller each time. If they started with cm and increased , they would need multiple larger pieces of card, which may not be available or would require cutting from a larger sheet, wasting material.
Answer
Less card is used; the student can use just one piece of card and cut it smaller each time.
Less card is used; can use just one piece of card.
Walkthrough
The student attaches a square card of side to the metre rule. If they start with cm and cut it down to 15 cm, 11 cm, etc., they are simply cutting off pieces from a single large card. This minimises waste and means they only need one piece of card initially. If they started with cm and wanted to increase to 19 cm, they would need to add more card or use multiple different sized cards, which is impractical and wastes material.
Key Takeaways
Experimental procedures should be designed to minimise waste and maximise the use of available apparatus. Starting with the largest required size and reducing it is more material-efficient.
Common Mistakes
- Saying "it is easier to cut" without mentioning material usage.
- Not mentioning that only one piece of card is needed.
Things to Be Careful About
- The mark scheme specifically looks for "less card used" or "can use just one piece of card". Ensure the answer focuses on material efficiency.
The rest of this paper
3 more questions- Q2Experimental Contexts · Planning Experiments and Investigations7M
- Q3Experimental Contexts · Observations and Measurements · Use of Techniques, Apparatus and Materials5M
- Q4Use of Techniques, Apparatus and Materials · Experimental Contexts5M