Physics 5054/42 — October/November 2015
Cambridge O-Level · Alternative to Practical · worked solutions for every part, with the mark scheme
Topics Experimental Contexts · Analysis, Conclusions and Evaluation · Use of Techniques, Apparatus and Materials · Observations and Measurements
A student performs an experiment to obtain an accurate value for the focal length of a converging lens.
His school has lenses with focal lengths and .
The student is given a lens from a packet labelled 'focal length '.
Describe a simple method the student can use in order to check that the lens has a focal length of . You may use a diagram in your answer.
Answer
Place the lens in front of a distant object (e.g. a window or a building outside). Move a screen behind the lens until a sharp, focused image of the distant object is formed. The distance from the lens to the screen is the focal length.
Place the lens in front of a distant object and form a sharp image on a screen; the distance from the lens to the screen is the focal length.
Walkthrough
Parallel rays from a very distant object arrive at the lens essentially parallel to the principal axis. A converging lens focuses these parallel rays to a single point at its principal focus. By placing a screen at this point and measuring the distance from the lens centre to the screen, the student obtains the focal length . If this measured distance is , the lens label is correct.
Key Takeaways
A distant object provides parallel incident rays. The image formed by a converging lens for parallel rays is at the principal focus, so the lens-to-image distance equals the focal length.
Common Mistakes
- Saying 'use a light source' without specifying that it must be at a large distance (so rays are parallel).
- Measuring from the surface of the lens instead of its centre.
Things to Be Careful About
The object must be sufficiently distant (typically ) for the rays to be considered parallel. The screen must be moved until the image is sharpest to locate the exact focus.
The student then uses the apparatus in Fig. 1.1 to obtain an accurate value for the focal length of the lens.
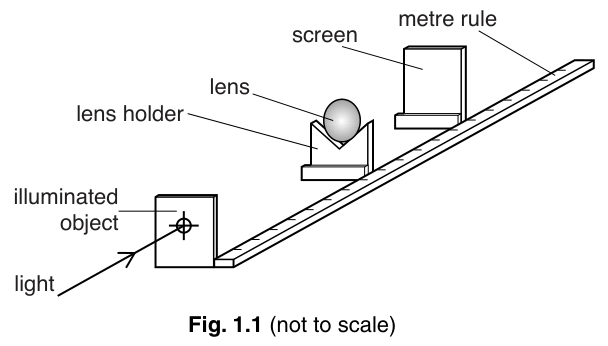
The student places the lens a measured distance from the illuminated object. He then adjusts the position of the screen until a clear focused image is seen on the screen. He measures the distance from the object to the focused image on the screen.
On Fig. 1.1, mark and label the lengths and .
Answer
- is the distance from the illuminated object to the lens.
- is the distance from the illuminated object to the screen.
is the distance from the illuminated object to the lens; is the distance from the illuminated object to the screen.
Walkthrough
The question states: 'places the lens a measured distance from the illuminated object' and 'measures the distance from the object to the focused image on the screen'. On the diagram, is the gap between the illuminated object and the lens centre. is the total gap from the illuminated object to the screen.
Key Takeaways
Always read the definitions of variables carefully from the question text. is the object distance, and is the total object-to-image distance, not the image distance .
Common Mistakes
- Marking as the distance from the lens to the screen (that is , not ).
- Drawing the arrows for and starting from different reference points.
Things to Be Careful About
Ensure the dimension lines for and are clearly drawn and labelled. includes plus the image distance , so .
The distance is set at and the student measures the distance . He repeats the experiment and obtains the following values, in , for .
96.5 96.3 96.2 96.1 96.2
Calculate , the average value of .
Give your answer to three significant figures.
= ______
Working
Rounding to three significant figures gives .
Answer
96.3 cm
Walkthrough
Sum the five repeated measurements of and divide by 5 to find the average. . Dividing by 5 gives . The question asks for three significant figures, so we round to . The unit cm is required for the mark.
Key Takeaways
When calculating an average, always include the correct unit in the final answer if the question provides a blank with a unit or asks for a physical quantity.
Common Mistakes
- Forgetting to include the unit 'cm' in the final answer.
- Rounding incorrectly (e.g. keeping 4 significant figures as 96.26).
Things to Be Careful About
The mark scheme explicitly states 'unit required B1'. Always write the unit next to the numerical value for physical quantities.
State one way in which the student can ensure that each measurement of is accurate.
Answer
View the metre rule perpendicularly to avoid parallax error when reading the scale. (Alternatively: move the screen backwards and forwards to find the sharpest image, or ensure the lens and screen are close to the ruler.
View the scale perpendicularly to avoid parallax error.
Walkthrough
To ensure accurate measurements on a metre rule, the observer's eye must be directly above the scale markings to avoid parallax error. Other valid methods include moving the screen slightly backwards and forwards to ensure the image is truly sharp (not just focused), or clamping the ruler to prevent it from moving.
Key Takeaways
Parallax error occurs when reading a scale from an angle. Viewing perpendicularly eliminates this. Finding the sharpest image also requires small movements of the screen.
Common Mistakes
- Saying 'be more careful' or 'use better equipment', which are not accepted.
- Suggesting moving the lens instead of the screen to find the sharp image (the lens position is fixed).
Things to Be Careful About
The mark scheme accepts several answers: avoiding parallax, moving screen backwards/forwards, darkened room, zero error check, clamping ruler, or ensuring components are at the same height. Any one is sufficient.
The student repeats the experiment for a range of values of and obtains a value for each time. The results are recorded in Fig. 1.2.
Fig. 1.2
| 85.0 | |
| 70.0 | 81.0 |
| 50.0 | 62.3 |
| 25.0 | 41.6 |
| 18.0 | 40.5 |
| 15.0 | 45.1 |
| 12.0 | 69.5 |
On Fig. 1.2, add your value of for from (b)(ii).
Answer
Add the value to the cell in the column corresponding to in the table.
96.3
Walkthrough
The value calculated in part (b)(ii) is . This corresponds to the measurement taken when . Enter this value into the first row of the table in Fig 1.2.
Key Takeaways
Always ensure calculated values are placed in the correct row corresponding to the independent variable.
Common Mistakes
- Entering the value in the wrong row or column.
Things to Be Careful About
No marks are awarded separately for this part, but it is required for the subsequent graph plotting.
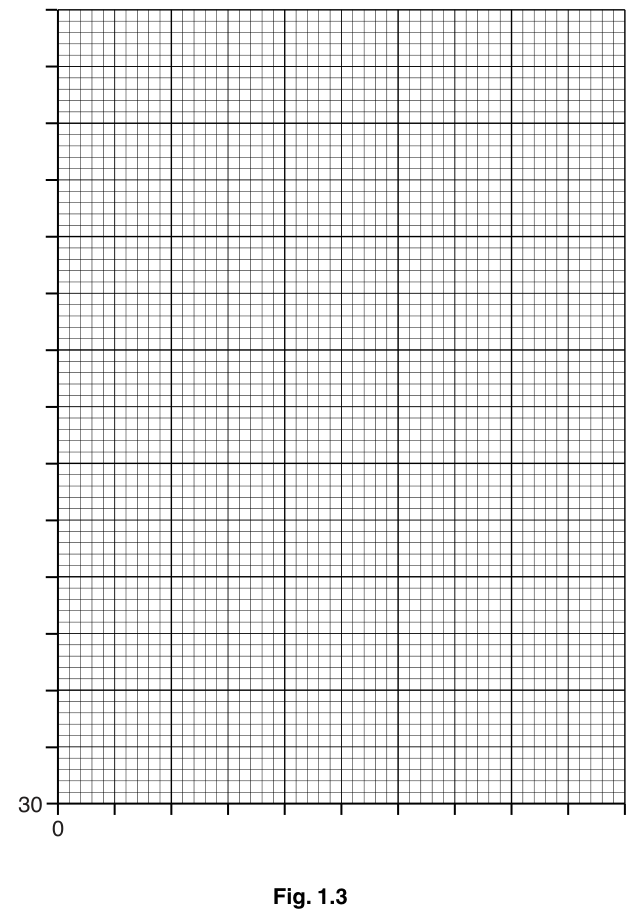
On Fig. 1.3, plot the graph of on the -axis against on the -axis. Start your axes from .
The graph shows that has a minimum value.
Draw the smooth curve of best fit.
Answer
Plot the graph with on the x-axis (0 to 90) and on the y-axis (30 to 100). Plot the points: (85.0, 96.3), (70.0, 81.0), (50.0, 62.3), (25.0, 41.6), (18.0, 40.5), (15.0, 45.1), (12.0, 69.5). Draw a smooth U-shaped curve of best fit through the points.
Graph plotted with a smooth U-shaped curve of best fit showing a minimum value of approximately 40 cm at u = 20 cm.
Walkthrough
The x-axis represents from 0 to 90 cm. The y-axis represents starting from 30 to 100 cm. Plot each data point accurately. The points form a U-shaped curve (a hyperbola-like shape) with a minimum. Draw a smooth curve that passes as close as possible to all points, balancing points above and below the curve.
Key Takeaways
When plotting graphs, ensure axes are labeled with quantity and unit, scales are linear and sensible, and points are plotted within half a small square. A best-fit curve should be smooth, not a join-the-dots line.
Common Mistakes
- Swapping the axes (putting on x and on y).
- Drawing a straight line through the points instead of a smooth curve.
- Points plotted inaccurately (more than half a small square off).
Things to Be Careful About
The axes must start from (0, 30) as instructed. The scales must be linear and use at least half the grid. The curve should be smooth and U-shaped, reflecting the lens equation relationship where .
Use your graph to find
the minimum value of ,
minimum value of = ______
Answer
From the graph, the minimum value of is approximately (any value between 39 and 41 cm is acceptable).
minimum value of = 40 cm
40 cm
Walkthrough
Locate the lowest point on the smooth curve of best fit. Read the corresponding value on the y-axis (). The minimum is around 40 cm. The mark scheme accepts any value from 39 to 41 cm.
Key Takeaways
Reading a minimum or maximum from a graph requires identifying the turning point and reading the axis value accurately.
Common Mistakes
- Reading the value from the y-axis at instead of at the minimum.
- Not reading to the precision of the graph scale.
Things to Be Careful About
The mark scheme allows a range of 39 to 41 cm. Ensure the value is read from the curve, not from a specific data point.
, the value of when is minimum.
= ______
Answer
From the graph, the value of at the minimum is approximately (any value between 18 and 22 cm is acceptable).
= 20 cm
20 cm
Walkthrough
From the minimum point on the curve, draw a vertical line down to the x-axis (). Read the value. It is approximately 20 cm. The mark scheme accepts .
Key Takeaways
The minimum of the vs graph occurs when , so .
Common Mistakes
- Reading the wrong axis.
- Not aligning the vertical line accurately with the minimum point.
Things to Be Careful About
The value must correspond to the minimum of the curve, not a data point. The range 18 to 22 cm is accepted due to graph reading uncertainty.
Theory shows that the minimum value for is when and when .
Calculate and from the values you have given in (c)(iii). Comment on your answers.
Working
From (c)(iii):
minimum value of , so
, so
Answer
Both values of are , which matches the label on the packet. The lens has a focal length of .
Comment: The calculated focal lengths from both methods agree with each other and with the labelled value of .
D_av/4 = 10 cm, u_m/2 = 10 cm; both values agree and match the labelled focal length of 10 cm.
Walkthrough
The theory states that the minimum total distance occurs when , giving and . Calculate from both: and . Both give , confirming the lens label is correct.
Key Takeaways
The minimum of the vs graph for a converging lens occurs at . This provides two independent ways to calculate and verify consistency.
Common Mistakes
- Forgetting to divide by 4 or 2.
- Not making a comment comparing the values to the labelled focal length.
Things to Be Careful About
The mark scheme requires both values to be correctly calculated AND a sensible comment. Simply giving the numbers without the comment may lose the mark.
The rest of this paper
3 more questions- Q2Experimental Contexts · Analysis, Conclusions and Evaluation · Observations and Measurements5M
- Q3Use of Techniques, Apparatus and Materials · Experimental Contexts · Analysis, Conclusions and Evaluation6M
- Q4Use of Techniques, Apparatus and Materials · Experimental Contexts · Analysis, Conclusions and Evaluation7M