Physics 5054/41 — October/November 2014
Cambridge O-Level · Alternative to Practical · worked solutions for every part, with the mark scheme
Topics Experimental Contexts · Use of Techniques, Apparatus and Materials · Analysis, Conclusions and Evaluation · Planning Experiments and Investigations
A student hangs two pendulums A and B from a metre rule, as shown in Fig. 1.1.
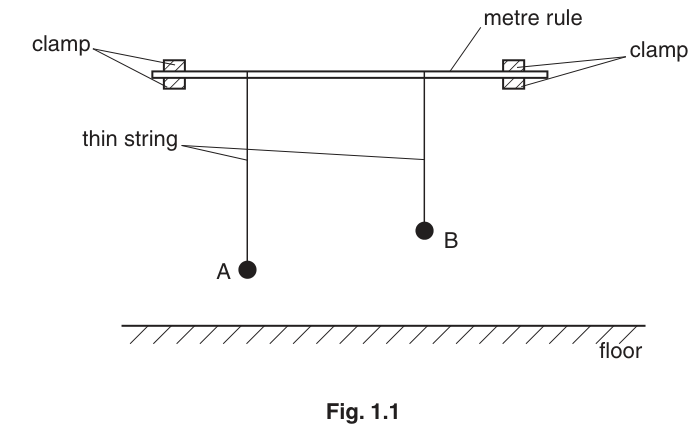
Describe how the student checks that the metre rule is horizontal. You may draw on Fig. 1.1 if you wish.
______
Answer
Use a spirit level on the metre rule. (Alternatively, measure the distance from the bench to both ends of the rule to ensure they are equal, or use a set square to check the strings are perpendicular to the rule.)
Use a spirit level on the metre rule (or measure the distance from the bench to both ends to ensure they are equal).
Walkthrough
To check that the metre rule is horizontal, the student needs a reliable reference level. The most direct method is to place a spirit level on the rule and adjust the clamps until the bubble is centred. Alternatively, if a spirit level is not available, the student can measure the vertical distance from a fixed reference (like the bench) to both ends of the metre rule; if the rule is horizontal, these two distances will be equal. A set square can also be used to check that the hanging strings are perpendicular to the rule, which implies the rule itself is horizontal.
Key Takeaways
Checking the alignment of apparatus is a fundamental experimental skill. Using a spirit level, a fixed reference line, or perpendicularity checks are all valid methods to establish a horizontal baseline.
Common Mistakes
Students sometimes suggest "looking along the rule" or "guessing" if it is level. These are not accurate techniques. The mark scheme specifically requires a measurable comparison (like distances from the bench) or a standard tool (spirit level, set square).
Things to Be Careful About
When using a set square to check perpendicularity, ensure the rule itself is level first, or use the set square against the strings to verify they hang vertically, which confirms the rule is horizontal. Always mention the tool or the measurable comparison clearly.
Pendulum A has length and its length does not change during the experiment.
Pendulum B is shorter than pendulum A, by a length .
On Fig. 1.1, mark and label the length .
Answer
See diagram.
Walkthrough
Pendulum A has length and pendulum B has length . The problem states B is shorter than A by a length . Therefore, . On the diagram, this is the vertical distance between the bottom of the string for pendulum B and the bottom of the string for pendulum A. Draw a horizontal line from the bottom of B's string to A's string and label it .
Key Takeaways
When dealing with differences in lengths in a diagram, draw a horizontal line connecting the two points of interest and label the difference clearly.
Common Mistakes
Labeling the entire length of pendulum A or B as , or drawing the line from the metre rule instead of from the bottom of the strings.
Things to Be Careful About
Ensure the label is placed clearly next to the horizontal line you draw, and that the line accurately represents the difference in length between the two bobs (or the bottom of the strings).
Describe how the student can measure accurately.
______
Answer
Measure the distance from the bench (or a fixed support) to the bottom of each bob while the pendulums are at rest. Subtract the two measurements to find . To avoid parallax error, place a set square against the bobs or read the scale at eye level.
Measure the distance from the bench to the bottom of each bob (at rest) and subtract the values, avoiding parallax error.
Walkthrough
To measure accurately, the student cannot just measure the difference directly with a ruler between the two bobs easily. Instead, they can measure the absolute length of each pendulum from a fixed reference point (like the bench or the metre rule itself). Let the distance from the bench to the bottom of bob A be and to bob B be . Then . It is crucial that the pendulums are not moving (at rest) to get a stable reading. Parallax error is a common source of inaccuracy when reading scales or measuring between objects; using a set square against the bobs ensures the measurement is taken at the correct vertical position.
Key Takeaways
Measuring differences indirectly by measuring absolute values from a common reference is a robust technique. Always state that the apparatus should be at rest and mention how parallax is avoided.
Common Mistakes
Suggesting to measure directly with a ruler between the two bobs without mentioning that they must be at rest, or not addressing parallax error.
Things to Be Careful About
The mark scheme specifically looks for "measure from bench / support to same point on each bob", "ensure the pendulum is not moving", and "explain how parallax error is avoided". All three elements strengthen the answer.
The student pulls A and B towards him and releases them at exactly the same time.
Pendulum A takes longer to complete one swing than pendulum B.
At the start, A and B swing backwards and forwards together, in step. They then become out of step and, after a while, A is swinging forwards when B is swinging backwards.
They then become back in step swinging backwards and forwards together.
The student counts the number of swings of A until A and B are exactly back in step.
The student repeats the experiment and finds for different values of .
The results are recorded in Fig. 1.2.
Fig. 1.2
| 3.0 | 55 |
| 5.0 | 32 |
| 7.0 | 22 |
| 9.0 | 17 |
| 11.0 | 13 |
| 13.0 | 10 |
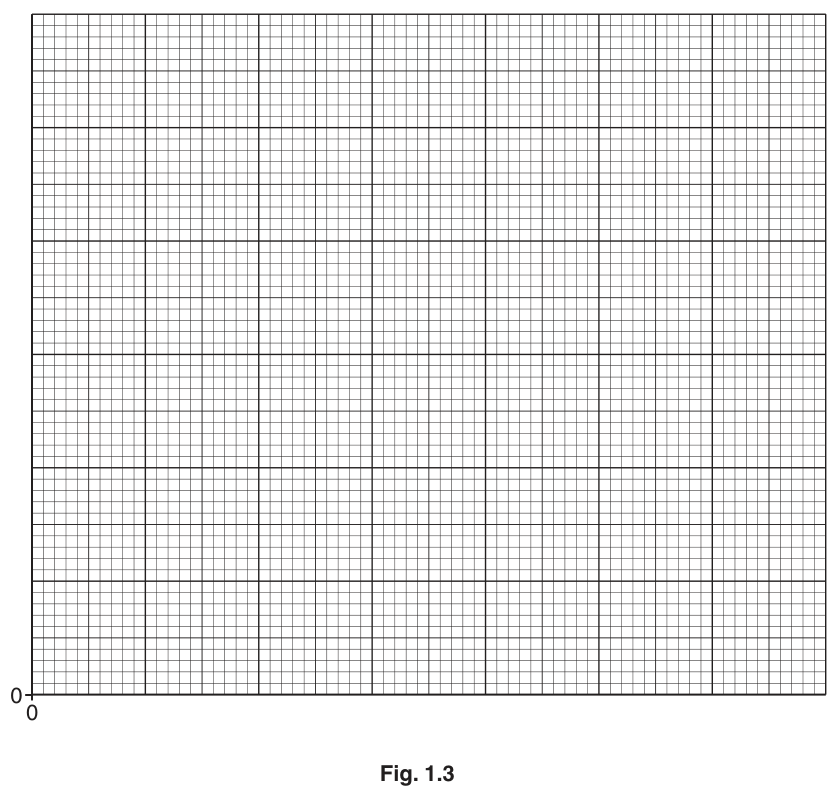
On Fig. 1.3, plot the graph of on the y-axis against on the x-axis.
Start your axes from the origin. Draw the smooth curve of best fit.
Answer
See graph.
Walkthrough
The student must plot on the y-axis against on the x-axis. The axes must start from the origin (0,0). The x-axis represents and should range from 0 to at least 14. The y-axis represents (no unit) and should range from 0 to at least 60. Plot the six data points: (3.0, 55), (5.0, 32), (7.0, 22), (9.0, 17), (11.0, 13), (13.0, 10). Finally, draw a smooth curve of best fit that passes close to all the points, showing a decreasing trend. Do not join the points with straight lines; the relationship is non-linear.
Key Takeaways
Graph plotting requires careful attention to axis labels (quantity and unit), linear scales that use at least half the grid, accurate plotting (within half a small square), and drawing a smooth curve of best fit for non-linear data.
Common Mistakes
Using non-linear scales, plotting points inaccurately, joining points with straight lines instead of a smooth curve, or forgetting to label the axes with units.
Things to Be Careful About
The x-axis is , so the values are 3.0, 5.0, etc. The y-axis is , which is a count (no unit). Ensure the scales are sensible; for example, x-axis could be 1 cm per small square (0 to 14), y-axis could be 5 or 10 per small square (0 to 60). The curve should be smooth, reflecting the inverse-like relationship.
Before taking any readings, the student attached the pendulums A and B close together on the metre rule.
Give one reason why it is helpful to have the strings close together.
______
Answer
It allows the student to observe both pendulums simultaneously and easily determine when they are back in step.
To observe both pendulums at the same time and easily see when they are back in step.
Walkthrough
The experiment requires counting the number of swings of A until A and B are back in step. If the pendulums are far apart, it is difficult to see both at the same time and judge their relative phases. Placing them close together allows the student to watch both bobs and easily notice when they swing forwards or backwards together.
Key Takeaways
Apparatus arrangement should facilitate the specific measurements or observations required by the experiment.
Common Mistakes
Saying "it makes it easier to count" without specifying that both can be observed simultaneously.
Things to Be Careful About
The mark scheme accepts "observe both together / observe simultaneously". Be specific about what is being observed (both pendulums) and why (to see when they are in step).
Suggest one problem this may cause.
______
Answer
The strings may tangle, or the bobs may collide during their swings.
The strings may tangle or the bobs may collide.
Walkthrough
If two pendulums are hung very close together, their swinging paths may intersect. This can cause the strings to wrap around each other (tangle) or the bobs to hit each other (collide), which would disrupt the motion and invalidate the timing.
Key Takeaways
Every experimental setup has potential sources of error or interference. Identifying physical interactions between components is key to evaluating an experiment.
Common Mistakes
Suggesting vague errors like "it is dangerous" or "it is difficult to see" without a specific physical mechanism.
Things to Be Careful About
The mark scheme accepts "strings tangle" or "bobs collide". These are direct physical consequences of the pendulums being too close.
The length of pendulum A is . The length of pendulum B is .
Use your graph in Fig. 1.3 to obtain a value for .
= ______
Working
Locate on the x-axis of the graph in Fig. 1.3. Read the corresponding value on the y-axis.
15
Walkthrough
First, calculate the value of for the given lengths: . Then, on the graph plotted in part (c), find 10.0 on the x-axis (). Move vertically up to the curve of best fit, then horizontally to the y-axis () to read the value. The value should be around 15 (accept 14 to 16 based on graph reading accuracy).
Key Takeaways
Interpolation involves using a graph to find a value between the plotted data points. Always calculate the independent variable value first if it is not directly given in the table.
Common Mistakes
Reading the graph incorrectly, or forgetting to calculate first and trying to use or directly on the x-axis.
Things to Be Careful About
The mark scheme allows . Ensure the graph was plotted correctly in part (c). Reading a graph requires careful alignment with the axes and using a large triangle or grid lines to read accurately.
Theory shows that
Calculate the value for when is and is .
Give your answer to two significant figures.
= ______
Working
Rounding to two significant figures:
15
Walkthrough
Substitute and into the given formula. Calculate the square roots: and . Subtract the denominator: . Divide the numerator by the denominator: . The question asks for the answer to two significant figures, so round 15.484 to 15.
Key Takeaways
Always show the substitution step in calculations. Pay attention to the required number of significant figures in the final answer.
Common Mistakes
Forgetting to use the square root function, calculating the denominator incorrectly, or giving the answer to too many significant figures (e.g., 15.5 or 15.48).
Things to Be Careful About
The mark scheme awards a C1 for the correct substitution/intermediate value (15.484) and an A1 for the final answer (15) to two significant figures. Ensure you use enough digits in intermediate steps to avoid rounding errors.
Comment on whether your two values for are in agreement.
______
Answer
Yes, the two values are in agreement. They are the same (or within 10% of each other), which is within the expected experimental error.
Yes, the values are in agreement as they are the same (or within experimental error).
Walkthrough
The value from the graph (part e(i)) is approximately 15. The calculated value (part e(ii)) is 15. Since the values are identical (or very close, within a 10% tolerance), they are in agreement. This suggests the theoretical formula accurately models the experimental situation, within the limits of the experiment.
Key Takeaways
Comparing experimental and theoretical values is a key part of evaluating an experiment. Agreement means the values are similar within experimental error.
Common Mistakes
Saying "yes" without giving a reason, or saying "no" because they are not exactly the same without considering experimental error.
Things to Be Careful About
The mark scheme accepts: "Yes, they are the same", or "Yes + close enough / within experimental error" if values are similar (±10%). If they differ by more than 10%, say "No + difference outside experimental error". Here, 15 and 15 are exactly the same, so the agreement is strong.
The rest of this paper
3 more questions- Q2Experimental Contexts · Use of Techniques, Apparatus and Materials · Analysis, Conclusions and Evaluation6M
- Q3Experimental Contexts · Analysis, Conclusions and Evaluation5M
- Q4Planning Experiments and Investigations · Experimental Contexts · Use of Techniques, Apparatus and Materials6M