Physics 5054/41 — October/November 2013
Cambridge O-Level · Alternative to Practical · worked solutions for every part, with the mark scheme
Topics Experimental Contexts · Analysis, Conclusions and Evaluation · Use of Techniques, Apparatus and Materials · Planning Experiments and Investigations · Observations and Measurements
A student investigates a wooden sphere rolling down a plastic channel and falling to the floor.
The channel is set up at the end of a bench.
The sphere is initially held in the channel at the position shown in Fig. 1.1.
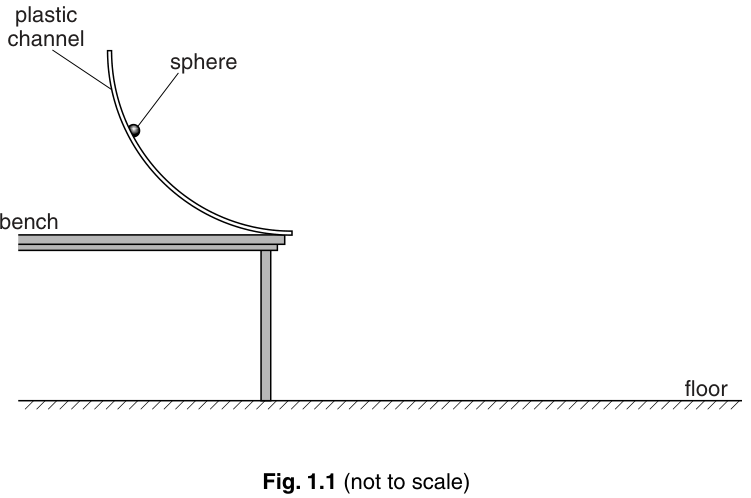
On Fig. 1.1, mark and label the height of the sphere above the bench before it is released.
Answer
Draw a vertical line or double-headed arrow from the bench surface up to the sphere (or the center/base of the sphere) and label it .
Vertical line drawn and labelled h from the bench surface to the sphere
Walkthrough
The height represents the vertical distance between the level of the bench surface and the sphere in its initial release position on the curved channel.
To mark this correctly on Fig. 1.1:
- Identify the horizontal line representing the surface of the bench.
- Identify the position of the sphere.
- Draw a vertical line or arrow spanning between the bench level and the sphere.
- Label this line clearly with the letter .
Key Takeaways
- Height is always measured vertically relative to a defined reference level (here, the top of the bench).
Common Mistakes
- Drawing a line along the curve of the track instead of measuring vertically.
- Measuring from the floor rather than from the bench.
Things to Be Careful About
- Ensure the line is drawn vertically by eye.
Describe how the student ensures that the sphere is released from the same point each time.
Answer
Make a mark (or pencil line) on the track / channel at the release position.
Make a mark on the channel at the release position
Walkthrough
To ensure fair testing and accurate repetition of measurements, the release position must remain identical across trials.
A practical and simple technique is to place a physical mark (such as a pencil line, marker dot, or a small piece of tape) directly on the curved channel at the chosen height . The sphere can then be lined up precisely with this mark before every release.
Key Takeaways
- Marking reference points on apparatus ensures high repeatability and minimizes human positioning error.
Common Mistakes
- Giving vague answers like 'be careful' or 'look closely' without describing a physical method.
Things to Be Careful About
- The suggestion must be a concrete, practical physical action.
The sphere is released, rolls down the channel and lands on the floor.
When the sphere leaves the end of the channel, it is travelling horizontally.
On Fig. 1.1,
draw a possible path of the sphere after it leaves the channel and until it hits the floor,
Answer
Draw a smooth curved downward path (a projectile trajectory / parabola) starting horizontally from the exit of the channel at the edge of the bench and curving downwards until it hits the floor.
Smooth downward curved path from the end of the channel to the floor
Walkthrough
When the sphere leaves the horizontal end of the channel, it possesses an initial horizontal velocity and zero vertical velocity. As it moves through the air, gravity causes it to accelerate vertically downwards while its horizontal velocity remains approximately constant. This produces a characteristic parabolic projectile path (curving downwards towards the floor).
Key Takeaways
- Projectiles launched horizontally follow a downward curving parabolic path.
Common Mistakes
- Drawing a straight diagonal line from the bench to the floor.
- Drawing an upward arc before falling.
Things to Be Careful About
- The path must start horizontally right at the channel exit.
mark and label the horizontal distance travelled by the sphere after it leaves the channel and until it hits the floor.
Answer
Draw a horizontal line or double-headed arrow extending from the vertical line through the end of the channel / bench edge to the point where the drawn path meets the floor, and label it .
Horizontal line labelled d from below the channel exit to the landing point on the floor
Walkthrough
The horizontal distance is the range of the projectile. It is measured horizontally from the point directly beneath the release edge (the exit of the channel) to the landing point on the floor.
Key Takeaways
- Range is purely horizontal distance measured from the launch position to the landing position.
Common Mistakes
- Drawing a diagonal line from the launch point to the impact point.
- Measuring from the leg of the bench rather than the launch point (channel exit).
Things to Be Careful About
- The line must be strictly horizontal.
Suggest a method for finding the point where the sphere hits the floor.
Answer
Place a tray of sand on the floor (or cover the floor with carbon paper / white paper, or coat the sphere with paint / ink) so that it leaves a mark where it hits.
Place a tray of sand on the floor to record the impact mark
Walkthrough
Because the sphere bounces and moves quickly upon hitting the floor, locating the exact point of first impact by eye alone is difficult and unreliable.
Acceptable practical methods to record the impact point:
- Placing a shallow tray of smooth sand on the floor so the sphere leaves a visible crater.
- Laying a sheet of carbon paper over white paper so the impact leaves a distinct dot.
- Dipping the sphere in paint, water, or chalk powder so it marks the floor on contact.
- Having an observer watch closely at floor level with a marker.
Key Takeaways
- Using recording media (sand, carbon paper, wet markers) allows accurate capture of instantaneous landing positions.
Common Mistakes
- Saying 'measure it with a ruler' without explaining how the exact impact point is first identified.
Things to Be Careful About
- Ensure the suggested method clearly describes how the point is marked or captured.
With set at , the student repeats the experiment and measures six times.
The student obtains the following values of in .
Calculate the average distance .
Give your answer to a suitable number of significant figures.
= ______
Working
Answer
66
66 cm
Walkthrough
To find the average distance :
- Sum all six individual distance values:
- Divide by the total number of readings (6):
- Look at the precision of the table values in Fig. 1.2: all values of are given to the nearest whole centimetre (2 significant figures). Rounding to the nearest whole number gives .
Key Takeaways
- The mean of repeated trials gives a more reliable estimate of the true value.
- The number of significant figures should be consistent with the data provided in the table.
Common Mistakes
- Giving too many decimal places (e.g. ), which is inconsistent with the data in Fig. 1.2.
Things to Be Careful About
- Round correctly ( rounds up to ).
The student repeats the experiment with different values of . The results obtained for and are recorded in Fig. 1.2.
Fig. 1.2
| 2 | 14 |
| 5 | 22 |
| 10 | 33 |
| 15 | 45 |
| 20 | 54 |
| 25 | 60 |
| 30 |
On Fig. 1.2, write your value for from (d).
By considering the experimental arrangement, suggest, with a reason, whether when .
Answer
Yes, because when , the sphere has no gravitational potential energy / is not moving, so it has no horizontal velocity when it leaves the bench (or falls straight down / does not roll).
Yes, because if h = 0 the sphere has no initial energy and no horizontal velocity
Walkthrough
When :
- The sphere is placed at the very bottom horizontal section of the channel.
- It has no initial gravitational potential energy relative to the channel exit to convert into kinetic energy.
- Therefore, it will not roll forward and will have zero horizontal velocity ().
- Without horizontal velocity, it cannot travel horizontally ().
(Alternatively, candidates can argue 'No' if they explain a systematic effect, e.g. the finite radius of the sphere means its center of mass is still above the bench surface). The standard expected physical answer is Yes because there is no horizontal speed.
Key Takeaways
- Extrapolating a physical system to zero often checks if the theoretical model matches physical boundary conditions.
Common Mistakes
- Answering 'yes' or 'no' without providing a supporting physical reason.
Things to Be Careful About
- Ensure the reasoning clearly links zero height to zero speed / energy.
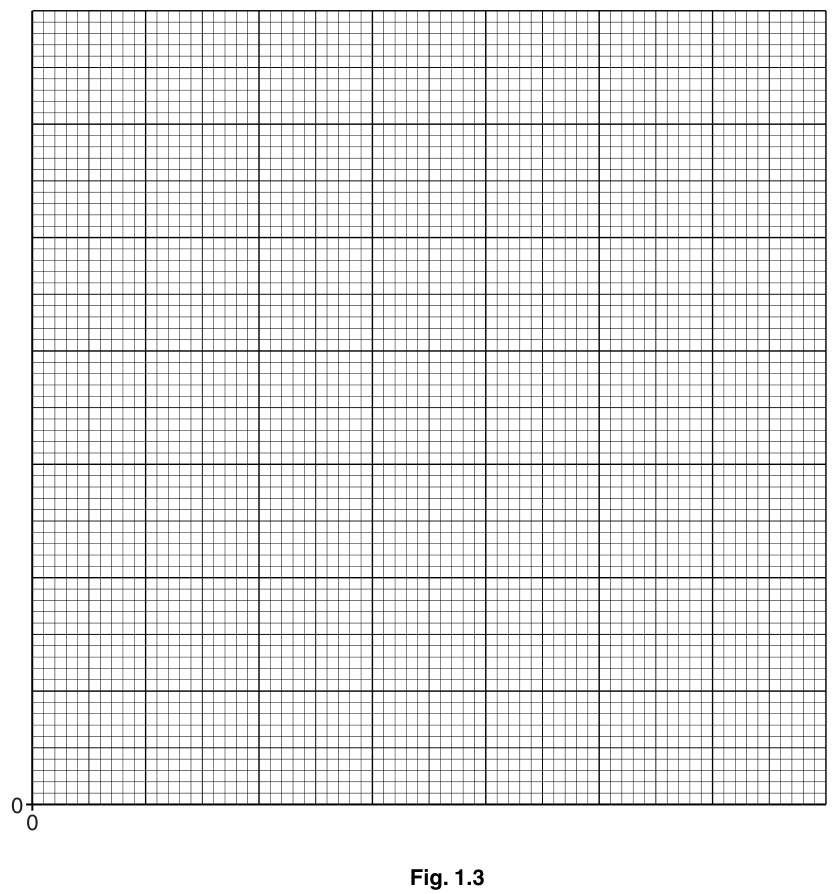
On Fig. 1.3, plot the graph of on the y-axis against on the x-axis.
Start your axes from the origin. Draw a smooth curve of best fit.
Working
- Axes and labels:
- x-axis:
- y-axis:
- Scales:
- Starting from :
- x-axis: (or , extending from to at least )
- y-axis: (or , extending from to at least )
- Points plotted:
- Best-fit line: A smooth, continuous curve passing through or evenly balancing all plotted points from the origin.
Answer
Smooth curve of best fit plotted through the points starting from the origin
Walkthrough
To obtain all 4 marks on the graph plotting task:
-
Axes and Units (1 mark):
- Label the horizontal axis .
- Label the vertical axis .
-
Scales (1 mark):
- Both axes must start at .
- The data range for is to . A standard scale of uses 6 large grid blocks (12 cm of grid).
- The data range for is to . A standard scale of uses 7 large grid blocks (14 cm of grid).
- Both scales are linear, easy to read, and occupy well over half of the available grid area.
-
Plotting Points (1 mark):
- Plot all 7 points from the table plus accurately to within half a small grid square using small, neat crosses () or circled dots ().
-
Line of Best Fit (1 mark):
- Draw a single, smooth curve passing smoothly through the trend of points without sharp bends, kinks, or double lines.
Key Takeaways
- Always include quantity and unit on axis labels.
- Scales must be linear and use more than half the grid.
- Curves of best fit must be drawn with a single smooth sweep.
Common Mistakes
- Forcing a straight line with a ruler through non-linear data.
- Using non-linear scales or awkward increments (e.g. multiples of 3 or 7).
- Drawing thick, 'furry', or multiple sketched lines.
Things to Be Careful About
- Ensure the line passes through or near the origin as required by the instruction to start axes from the origin.
Another student suggests that is directly proportional to .
Use your graph to explain whether this student is correct.
Answer
The student is not correct because the graph is a curve (not a straight line).
Incorrect, because the graph is a curve / not a straight line
Walkthrough
For two quantities to be directly proportional:
- The graph of against must be a straight line.
- The straight line must pass through the origin .
From the plotted graph, the line is a curve with a decreasing gradient, not a straight line. Therefore, is not directly proportional to .
Key Takeaways
- Direct proportionality requires a straight line passing through . Any curvature means the relationship is not directly proportional.
Common Mistakes
- Stating 'yes because as increases, increases' (this is a positive correlation, not direct proportionality).
Things to Be Careful About
- The explanation must state that the graph is curved / not a straight line.
The rest of this paper
3 more questions- Q2Experimental Contexts · Analysis, Conclusions and Evaluation · Use of Techniques, Apparatus and Materials6M
- Q3Experimental Contexts · Use of Techniques, Apparatus and Materials · Analysis, Conclusions and Evaluation7M
- Q4Experimental Contexts · Planning Experiments and Investigations · Analysis, Conclusions and Evaluation5M