Physics 5054/41 — May/June 2013
Cambridge O-Level · Alternative to Practical · worked solutions for every part, with the mark scheme
Topics Experimental Contexts · Observations and Measurements · Use of Techniques, Apparatus and Materials · Analysis, Conclusions and Evaluation · Planning Experiments and Investigations
A student investigates the time taken for a light paper cup to fall to the floor.
The student holds one paper cup, as shown in Fig. 1.1.
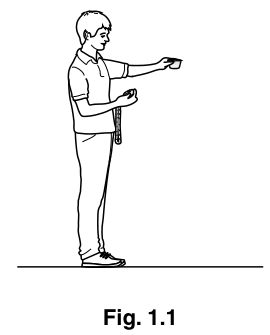
The student drops the cup and measures the time for it to fall to the floor.
The student repeats the experiment and obtains the following five values for , measured in seconds.
Calculate , the average value for .
Give your answer to two decimal places.
= ______
The student records his value for to more than two decimal places. Suggest why two decimal places is more suitable in this case.
The student finds it difficult to drop the cup and measure . Suggest how two students working together can measure more accurately.
The student repeats the experiment with two cups, as shown in Fig. 1.2.
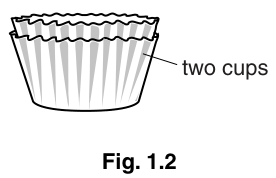
The experiment is repeated for an increasing number of cups. The results obtained are recorded in Fig. 1.3, where is the number of cups.
Add to Fig. 1.3 your value of for one cup from (a)(i).
Fig. 1.3
| 1 | |
| 2 | 0.89 |
| 3 | 0.82 |
| 5 | 0.69 |
| 7 | 0.63 |
| 9 | 0.61 |
| 11 | 0.61 |
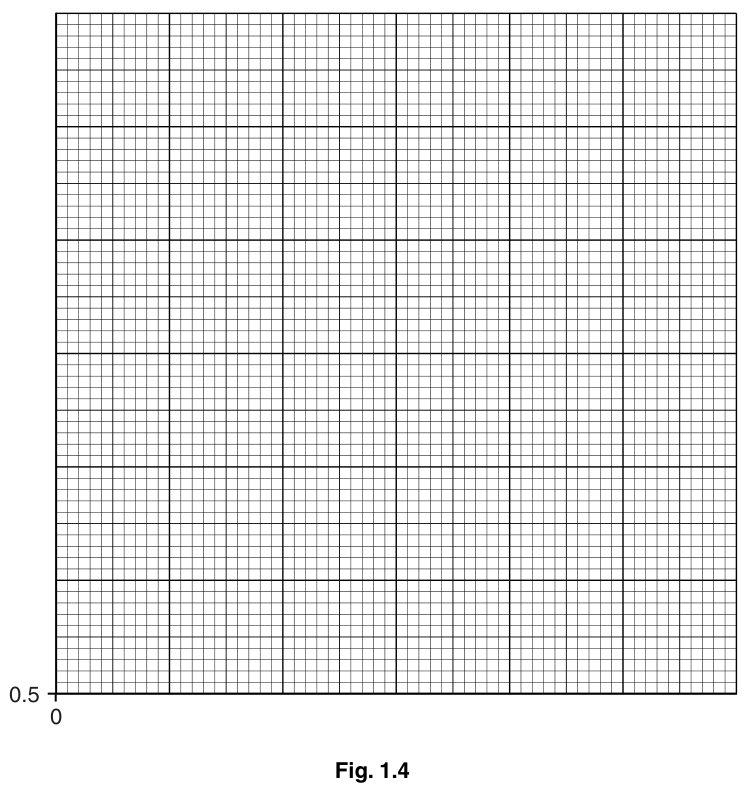
On Fig. 1.4, plot the graph of on the y-axis against on the x-axis.
Start your axes from and . Draw the smooth curve of best fit.
When two quantities and are inversely proportional to each other, they obey the relationship
Use data from the graph or table to explain whether is inversely proportional to .
It is important to drop the cup from the same height each time. Explain how the student does this without measuring the height.
Name the physical quantity being changed by increasing the number of cups.
The student accidentally stands on one cup. Explain why it should not be used in the investigation.
Suggest a reason why the last two values for in Fig. 1.3 are the same.
The rest of this paper
3 more questions- Q2Experimental Contexts · Use of Techniques, Apparatus and Materials · Observations and Measurements4M
- Q3Observations and Measurements · Experimental Contexts · Use of Techniques, Apparatus and Materials · Analysis, Conclusions and Evaluation7M
- Q4Experimental Contexts · Planning Experiments and Investigations4M