Physics 5054/42 — May/June 2012
Cambridge O-Level · Alternative to Practical · worked solutions for every part, with the mark scheme
Topics Experimental Contexts · Analysis, Conclusions and Evaluation · Use of Techniques, Apparatus and Materials · Observations and Measurements · Planning Experiments and Investigations
A student investigates the cooling of water.
Some of the apparatus is set up as shown in Fig. 1.1.
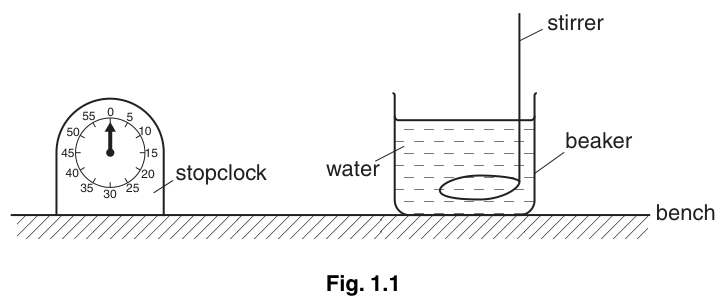
A volume of 100 of boiling water is poured into the beaker. The student starts the stopclock when the temperature of the water is .
The water is allowed to cool and its temperature is recorded every 2 minutes.
On Fig. 1.1, draw the thermometer in the most suitable position for measuring the temperature of the water as it cools.
Suggest a reason why the thermometer should be held in a clamp.
Describe how the student avoids parallax error when reading the thermometer.
The stopclock measures to the nearest second. Suggest why, in this experiment, the student does not need to use a digital stopwatch measuring to 0.01 s.
Explain why the student places the stopclock close to the beaker.
The student records his results in a table. Fig. 1.2 shows the student’s results.
Fig. 1.2
| time / minutes | / |
|---|---|
| 0 | 90 |
| 2 | 76 |
| 4 | 69 |
| 6 | 65 |
| 8 | 61 |
| 10 | 58 |
| 12 | 55 |
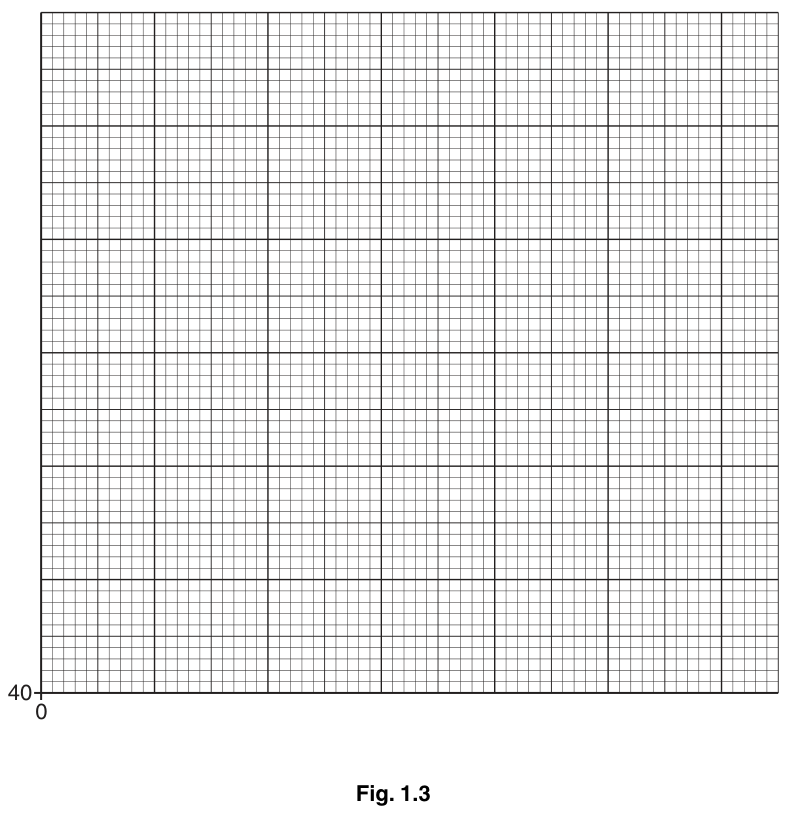
On Fig. 1.3, plot the graph of / on the -axis against / minutes on the -axis.
Start your graph from and .
Draw a curved line of best fit.
Explain why the temperature of the water does not fall to .
Use your graph to determine the time taken for the temperature of the water to fall from to .
time taken = ______
The experiment is repeated with the same volume of water in a wider beaker, as shown in Fig. 1.4.
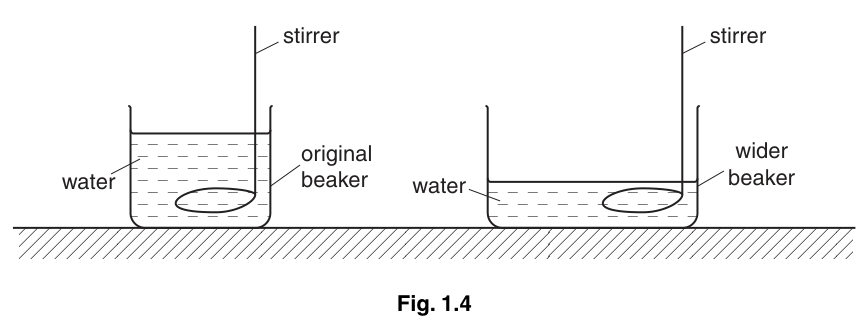
State and explain the effect of using the wider beaker on the time taken for the temperature of the water to fall from to .
The rest of this paper
3 more questions- Q2Experimental Contexts · Analysis, Conclusions and Evaluation6M
- Q3Use of Techniques, Apparatus and Materials · Experimental Contexts · Analysis, Conclusions and Evaluation5M
- Q4Experimental Contexts · Observations and Measurements · Analysis, Conclusions and Evaluation · Planning Experiments and Investigations · Use of Techniques, Apparatus and Materials6M