Physics 5054/42 — May/June 2011
Cambridge O-Level · Alternative to Practical · worked solutions for every part, with the mark scheme
Topics Experimental Contexts · Use of Techniques, Apparatus and Materials · Analysis, Conclusions and Evaluation · Observations and Measurements · Planning Experiments and Investigations
A student investigates the motion of a toy car down a ramp.
The toy car is released from rest on the ramp at position 1, as shown in Fig. 1.1.
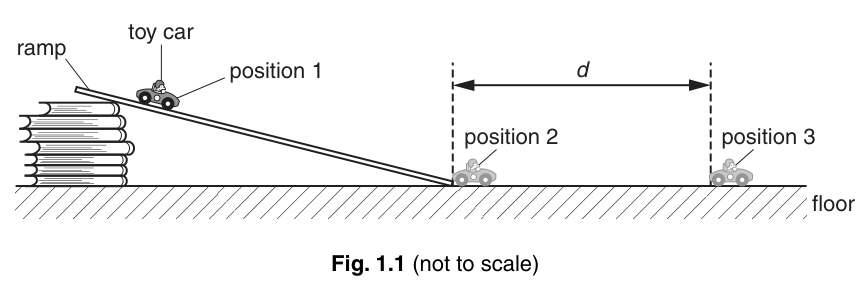
The toy car leaves the ramp at position 2. It travels a distance along the floor and comes to rest at position 3. Distance is between 1 and 2 metres.
Suggest a method for measuring .
______
Answer
Place two metre rules end to end along the floor between positions 2 and 3, or use a single measuring tape.
Two metre rules placed end to end, or a measuring tape
Walkthrough
The distance is between 1 and 2 metres. A single standard 30 cm or 1 m ruler is insufficient for a single measurement without moving it, which introduces error. The simplest and most accurate method is to use a measuring tape, or to place two 1 m rules end to end along the floor to cover the distance in one go.
Key Takeaways
When measuring a distance that exceeds the length of a single standard ruler, either use a longer instrument (measuring tape) or chain multiple instruments end to end to avoid cumulative error from repeated positioning.
Common Mistakes
Suggesting to move a single ruler along the floor and mark the distance; this introduces parallax and alignment errors at each step. Simply saying "use a ruler" is too vague if the ruler is shorter than the distance.
Things to Be Careful About
Ensure the measuring instrument is placed flat along the floor and aligned with the vertical dashed lines at positions 2 and 3. Readings should be taken to the nearest millimetre if using a rule, or 1 cm if using a tape.
Describe how the student ensures that the toy car is released from the same point on the ramp each time.
Answer
Place a marker (such as a piece of tape or a pencil mark) on the ramp at the desired release position. Before each release, align this marker with a fixed point on the toy car (for example, the front bumper or the rear of the lowest wheel).
Place a marker on the ramp and align it with a fixed point on the car before releasing.
Walkthrough
To ensure the car is released from the exact same position each time, the student needs a reliable reference point. A physical marker on the ramp (like a piece of tape) provides a fixed target. The student then aligns a specific, easily identifiable part of the car (e.g., the front bumper) with this marker before letting go. This removes ambiguity about where the car starts.
Key Takeaways
Repeatability in experiments requires fixed reference points. Marking the apparatus and aligning a consistent feature of the object being tested eliminates positional ambiguity.
Common Mistakes
Saying "release it carefully" or "make sure it is at the same point" without explaining how. The mark scheme requires a practical technique: a marker on the ramp and an alignment point on the car.
Things to Be Careful About
Ensure the marker on the ramp is visible and does not obstruct the car's path. Aligning the same point on the car every time is crucial; if the car is slightly angled, the effective release height changes.
On Fig. 1.1, mark the height through which the toy car falls from position 1 to position 2.
Answer
Draw a vertical double-headed arrow (or a vertical line with arrows at both ends) starting from the horizontal floor level and ending at the level of the toy car at position 1. Label this vertical distance . The arrow should span the vertical gap between the floor and the car (typically from the floor to between the lower wheel and the top of the car body).
Vertical height marked from the floor to the car at position 1.
Walkthrough
The height represents the gravitational potential energy conversion. It is the vertical distance the car's center of mass (or effectively, the car itself) falls. On the diagram, this is measured from the horizontal floor up to the car at position 1. A vertical line with arrows at both ends clearly indicates a height measurement. It must be strictly vertical, not along the slope of the ramp.
Key Takeaways
Height in energy and motion contexts is always a vertical measurement. On a diagram, use a vertical double-headed arrow to denote it, ensuring it is perpendicular to the horizontal floor.
Common Mistakes
Drawing the height along the slope of the ramp instead of vertically. Drawing the arrow from the top of the ramp support to the floor instead of to the car itself. Forgetting to label it .
Things to Be Careful About
The mark scheme accepts the vertical height from the floor to between the lower wheel and the top of the car. Do not draw a diagonal line along the ramp; height is strictly vertical.
The student releases the toy car from the same point on the ramp five times and measures each time. The student obtains the following values of in centimetres.
Calculate , the average value for .
Give your answer to a suitable number of significant figures.
= ______
Working
Rounding to 3 significant figures:
(Alternatively, )
Answer
= 175 cm
175 cm
Walkthrough
The student obtained five measurements: 180, 179, 171, 172, and 174 cm. To find the average (), sum these values and divide by the number of measurements (5).
Sum = 180 + 179 + 171 + 172 + 174 = 876 cm.
Average = 876 / 5 = 175.2 cm.
The question asks for a suitable number of significant figures. The original data are given to 3 significant figures (e.g., 180, 179). Therefore, the average should also be given to 3 significant figures, which is 175 cm. (1.75 m is also acceptable and equivalent).
Key Takeaways
Averages should be reported to the same number of significant figures as the raw data, unless the calculation naturally yields a more precise value. Always include units.
Common Mistakes
Forgetting to divide by 5 (just giving the sum). Giving the answer as 175.2 cm (4 sig figs) when the data only justify 3. Forgetting to include the unit 'cm' or 'm'.
Things to Be Careful About
Ensure all values are in the same unit before summing. The mark scheme accepts 175 cm or 1.75 m. 175.2 is technically more precise but 175 is the appropriate 3 sig fig answer for O Level.
Suggest a reason why the results for vary.
______
Answer
The results vary due to random errors such as: slight variations in the push given to the car on release, the car not travelling in a perfectly straight line, slight differences in friction on the ramp or floor between runs, or parallax error when measuring the stopping distance .
The car may not travel in a straight line, or friction may vary slightly between runs.
Walkthrough
The values of (180, 179, 171, 172, 174) are not identical. This variation is due to random errors in the experimental procedure. Possible causes include: the student giving the car a tiny extra push each time, the car veering slightly left or right (increasing the actual distance travelled), minor dust or imperfections on the ramp/floor changing friction, or the student reading the end position from slightly different angles (parallax error).
Key Takeaways
Repeated measurements rarely yield identical results. Random errors cause scatter in the data. Identifying plausible physical causes for this scatter demonstrates understanding of experimental limitations.
Common Mistakes
Suggesting systematic errors (e.g., 'the ruler is too short' or 'zero error') — these would shift all results in one direction, not cause scatter. Saying 'human error' without specifying what the human error actually is (e.g., 'parallax error' or 'inconsistent release').
Things to Be Careful About
The mark scheme accepts a variety of valid random error sources. Focus on things that vary randomly from trial to trial: release technique, path straightness, friction, or measurement reading angle.
By adjusting the angle of the ramp, the student repeats the experiment for different values of the height .
The results obtained for and are recorded in Fig. 1.2.
Fig. 1.2
| 22 | 124 |
| 20 | 109 |
| 18 | 94 |
| 16 | 84 |
| 14 | 70 |
| 12 | 55 |
| 10 | 44 |
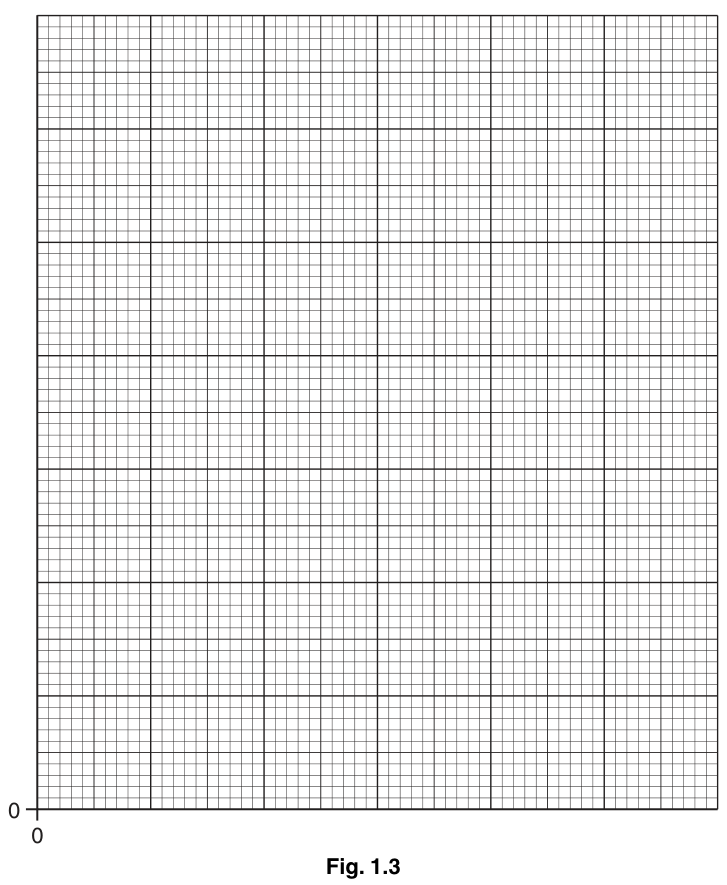
On Fig. 1.3, plot the graph of on the -axis against on the -axis.
Draw the line of best fit.
Answer
Plot the graph with on the x-axis and on the y-axis.
- x-axis: Label ''. Scale from 0 to 25 cm (e.g., 2 cm on grid = 5 cm, or 1 cm = 2.5 cm). Mark 0, 5, 10, 15, 20, 25.
- y-axis: Label ''. Scale from 0 to 130 cm (e.g., 2 cm on grid = 25 cm, or 1 cm = 12.5 cm). Mark 0, 25, 50, 75, 100, 125.
- Points: Plot (10, 44), (12, 55), (14, 70), (16, 84), (18, 94), (20, 109), (22, 124). Ensure each point is within half a small square of its true coordinate.
- Line of best fit: Draw a straight line that passes as close as possible to all points, with roughly equal numbers of points on either side of the line. The line should not necessarily pass through the origin (0,0).
Graph plotted with on x-axis (0-25) and on y-axis (0-130), points plotted accurately, straight line of best fit drawn not through origin.
Walkthrough
The student must plot (y-axis) against (x-axis). The data ranges from to cm and to cm.
- Axes and labels: The x-axis must be and the y-axis must be . The labels must be correct way round (quantity / unit).
- Scales: The grid needs to accommodate 0-25 on x and 0-130 on y. A sensible scale is 2 cm on the grid = 5 cm on x-axis (giving 25 cm over 10 grid cm) and 2 cm on the grid = 25 cm on y-axis (giving 125 cm over 10 grid cm). Both scales must use more than half the available grid.
- Plotting: Plot each pair: (10, 44), (12, 55), (14, 70), (16, 84), (18, 94), (20, 109), (22, 124). Points must be plotted to within half a small square.
- Line of best fit: Draw a straight line that minimizes the distance to all points. It should not be forced through the origin; the data clearly show a y-intercept around 20-30 cm.
Key Takeaways
Graph plotting requires careful scale selection to maximize grid usage, accurate point placement, and a balanced line of best fit that reflects the trend without forcing it through arbitrary points like the origin.
Common Mistakes
Swapping the axes (plotting on y-axis). Using awkward scales (e.g., 1 cm = 3 cm) that make plotting difficult. Forcing the line of best fit through the origin (0,0) when the data clearly do not support it. Drawing a 'join-the-dots' line instead of a smooth line of best fit.
Things to Be Careful About
Use a sharp pencil for plotting and drawing the line. The line of best fit is a straight line; do not draw a curve even if one point is slightly off. Ensure the scales are sensible and clearly labelled with both quantity and unit.
Describe the relationship between and .
______
Answer
As increases, increases. The relationship is linear (a straight line), but it is not directly proportional because the line does not pass through the origin.
(Mathematically: , where and are constants.)
As h increases, d_av increases linearly, but the relationship is not directly proportional as the line does not pass through the origin.
Walkthrough
Looking at the plotted graph, the points form a straight line with a positive gradient. This means that as the height increases, the distance also increases. However, the line does not pass through the origin (0,0); it has a positive y-intercept. Therefore, is not directly proportional to (which would require a line through the origin). The correct description is that increases linearly with , or that there is a linear relationship between them.
Key Takeaways
When describing a graph, note the trend (increasing/decreasing) and the shape (linear/curved). If it is a straight line not through the origin, it is linear but not directly proportional. Direct proportionality requires both a straight line and a zero intercept.
Common Mistakes
Saying 'd is directly proportional to h' when the line does not go through the origin. Saying 'd increases as h increases' without mentioning that it is a linear relationship. Simply saying 'they are related'.
Things to Be Careful About
The mark scheme specifically looks for 'as h increases d increases' PLUS 'linear' or 'not directly proportional' or 'not through origin'. Giving only one of these may not earn the mark. Ensure you distinguish between 'proportional' and 'linear'.
The car is now released with . Use your graph to state what happens to the car.
______
Answer
At cm, the graph line would be below or near the x-axis (since the y-intercept is around 20-30 cm). This means would be zero or negative, which is physically impossible.
Therefore, the car does not move (or stops before reaching position 2 / does not reach the bottom of the ramp).
The car does not move (or stops before reaching position 2).
Walkthrough
The question asks what happens when cm. Looking at the graph, the line of best fit has a y-intercept of approximately 20-30 cm. If we extend the line back to cm on the x-axis, the corresponding value on the y-axis would be negative or zero. Since a negative distance is impossible, and a distance of zero means the car doesn't travel, the physical interpretation is that the car does not have enough energy to overcome friction and travel to position 3. In fact, at cm, the car likely doesn't even reach position 2 (the bottom of the ramp) or stops very close to it.
Key Takeaways
Extrapolating a graph outside the range of data can reveal physical limitations. When a linear trend predicts a negative value for a physical quantity like distance, it indicates the model breaks down and the physical object does not exhibit the expected behavior (e.g., it doesn't move).
Common Mistakes
Saying 'the car moves a very small distance' without justifying it from the graph's intercept. Failing to mention that the car 'does not move' or 'stops'. Not reading the graph at all and just guessing.
Things to Be Careful About
The mark scheme requires the car to be implied in the answer. 'Does not move' or 'stops before reaching point 2' are the expected answers. The graph clearly shows that for small , is zero. Don't just calculate with the extrapolated line; interpret the physical meaning of .
The rest of this paper
3 more questions- Q2Experimental Contexts · Use of Techniques, Apparatus and Materials · Observations and Measurements5M
- Q3Experimental Contexts · Use of Techniques, Apparatus and Materials · Observations and Measurements · Analysis, Conclusions and Evaluation6M
- Q4Experimental Contexts · Planning Experiments and Investigations · Observations and Measurements · Analysis, Conclusions and Evaluation6M