Physics 5054/42 — May/June 2010
Cambridge O-Level · Alternative to Practical · worked solutions for every part, with the mark scheme
Topics Experimental Contexts · Analysis, Conclusions and Evaluation · Observations and Measurements · Use of Techniques, Apparatus and Materials
A group of students performs an experiment to investigate the flow of oil at different temperatures.
of oil is heated gently and its temperature is recorded. The oil is then poured through a funnel into a second beaker, as shown in Fig. 1.1.
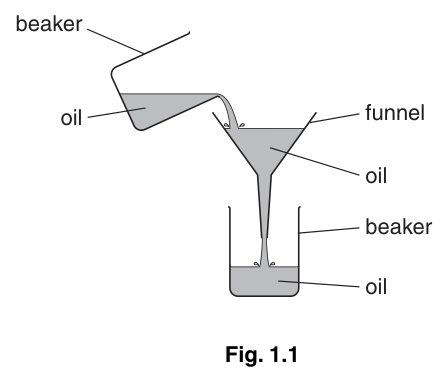
The time taken for the oil to flow through the funnel is recorded with a stopwatch.
State why it is important to stir the oil during heating.
Explain why the oil is heated gently.
The experiment is repeated for several values of . Values of and are recorded in the table of Fig. 1.2.
Fig. 1.2
| 69 | 13.69 |
| 52 | 14.97 |
| 35 | 17.34 |
| 24 | 21.16 |
| 17 | 25.16 |
| 10 | 28.85 |
On Fig. 1.3, plot the graph of on the -axis against on the -axis.
Start your graph from and . Draw the curved line of best fit.
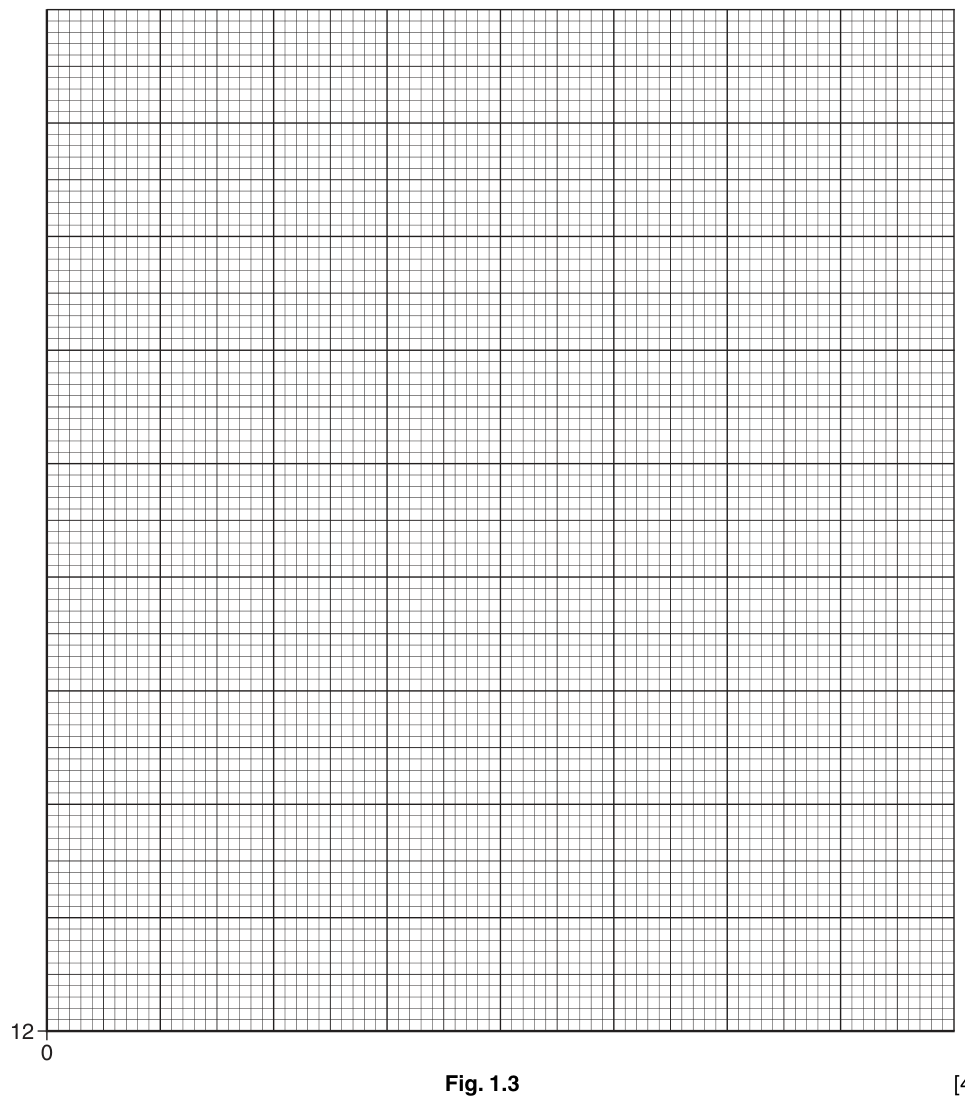
Estimate the time taken for oil at to flow through the funnel.
______
State the maximum reading on a standard laboratory liquid-in-glass thermometer that is suitable for this experiment.
______
Explain why it is not possible to repeat a reading immediately after it is taken.
Tick two boxes to show which of the following will make the experiment more accurate.
| using a more sensitive thermometer | |
| using two people to take the measurements | |
| using a thicker oil | |
| using a larger range of readings | |
| pouring the oil quickly after taking its temperature |
The rest of this paper
3 more questions- Q2Observations and Measurements · Experimental Contexts · Analysis, Conclusions and Evaluation7M
- Q3Analysis, Conclusions and Evaluation · Observations and Measurements5M
- Q4Experimental Contexts · Use of Techniques, Apparatus and Materials7M