Additional Mathematics 4037/11 — May/June 2020
Cambridge O-Level · Calculator · worked solutions for every part, with the mark scheme
Topics Calculus · Trigonometry · [Legacy] Indices and surds · Straight-line graphs · Factors of polynomials · Equations, inequalities and graphs · +5 more
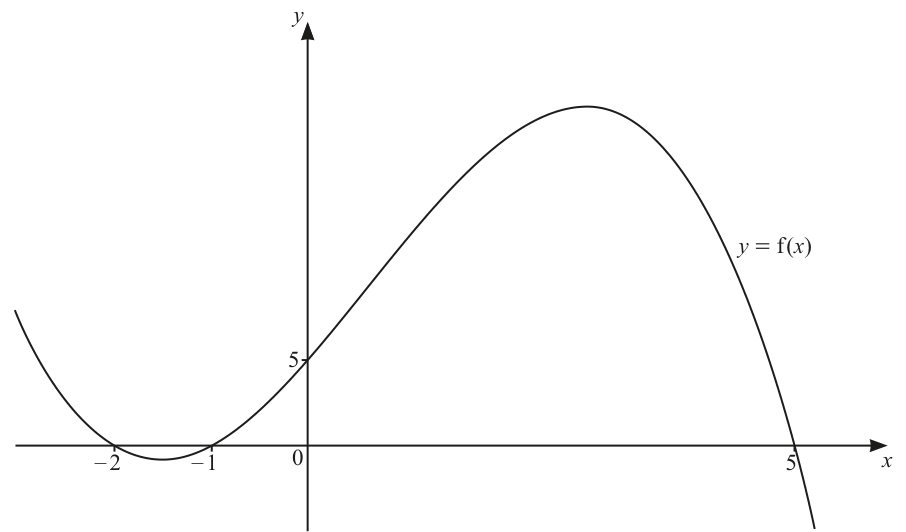
The diagram shows the graph of a cubic curve .
Find an expression for .
Approach
The graph crosses or touches the -axis at , and , so these are the three roots. Write and find from the -intercept .
Working
Using :
Answer
f(x) = -(1/2)(x + 2)(x + 1)(x - 5)
Walkthrough
The curve meets the -axis at and and touches it at , so each of , and is a factor. The general cubic with these roots is for some constant . Substituting , where the graph shows , gives , so . The negative sign is consistent with the shape: the curve falls to as .
Key Takeaways
- A cubic's -intercepts give its factors directly; a touch point is still a root.
- The vertical stretch factor is fixed by any one other known point, usually the -intercept.
Common Mistakes
- Writing instead of for the root (sign slips in the brackets).
- Forgetting the constant entirely, which would give -intercept rather than .
- Missing the negative sign on — the mark scheme awards B1 specifically for .
Things to Be Careful About
- Both B marks are accuracy-only (B1 for the bracket product, B1 for ), so both must be exactly right — no follow-through.
- Check your answer by substituting : it should return .
Solve .
Approach
means the parts of the graph on or below the -axis. Read those intervals straight off the sketch.
Working
From the graph, the curve is below the -axis between and (including the endpoints, since equality is allowed), and again for all beyond .
Answer
-2 <= x <= -1 or x >= 5
Walkthrough
Solving graphically means finding every for which the curve sits on or below the -axis. Between and the curve dips below the axis (it touches at ); after crossing at it stays below forever. Because the inequality is (not strict), the boundary points , and are included.
Key Takeaways
- An inequality like is answered by reading intervals from the graph, not by algebra here.
- includes the endpoints; would exclude them.
Common Mistakes
- Using strict inequalities and losing the endpoint marks.
- Including the region between and , where the curve is above the axis.
- Giving only one of the two intervals — each interval carries its own B1.
Things to Be Careful About
- Each interval is a separate B1 mark, so both must be stated with correct inclusive signs.
The rest of this paper
10 more questions- Q2Trigonometry4M
- Q3Calculus4M
- Q4[Legacy] Indices and surds · Quadratic functions5M
- Q5Calculus · Straight-line graphs6M
- Q6Simultaneous equations · Straight-line graphs8M
- Q7Circular measure8M
- Q8[Legacy] Indices and surds · Calculus · Logarithmic and exponential functions9M
- Q9Series12M
- Q10Trigonometry12M
- Q11Calculus · Trigonometry8M