Mathematics (Syllabus D) 4024/12 — May/June 2025
Cambridge O-Level · Non-calculator · worked solutions for every part, with the mark scheme
Topics Number · Algebra and Graphs · Geometry · Transformations and Vectors · Mensuration · Statistics · +2 more
Work out.
Approach
Evaluate the expression using the order of operations. Multiplication takes precedence over subtraction.
Working
First, perform the multiplication: .
Substitute this back into the expression:
Subtracting a negative is equivalent to adding a positive:
Answer
14
Walkthrough
To solve , we must follow the standard order of operations (often remembered by acronyms like BODMAS or PEMDAS), which dictates that multiplication is performed before addition or subtraction.
- Identify the multiplication part: .
- Calculate the product: A positive times a negative gives a negative, so .
- Replace the multiplication in the original expression with the result: The expression becomes .
- Simplify the double negative: Subtracting a negative number is the same as adding its positive counterpart. So, becomes .
- Perform the final addition: .
Key Takeaways
- Always check for multiplication or division before doing addition or subtraction.
- Remember the sign rules for multiplication: positive × negative = negative.
- Remember the sign rule for subtraction: minus a negative equals plus a positive.
Common Mistakes
- Performing the subtraction first () and then multiplying (). This violates the order of operations.
- Getting the sign wrong in the final step, such as thinking .
Things to Be Careful About
- Ensure you do not ignore the brackets around the . It represents a negative number being multiplied, not just a subtraction of 4 later on.
Approach
Calculate . Since is a terminating decimal, it can be easily converted to a fraction to simplify the calculation.
Working
Convert the decimal to a fraction:
Now multiply:
Perform the division:
Alternatively, multiply directly:
Answer
16
Walkthrough
We need to find the value of .
Method 1: Using Fractions
- Recognize that is the same as , which simplifies to .
- Multiply 80 by . This is equivalent to dividing 80 by 5.
- .
Method 2: Direct Multiplication
- Ignore the decimal point initially and multiply .
- Count the total decimal places in the factors. There is one decimal place in .
- Place the decimal point in the result so that there is one decimal place: , which is simply .
Key Takeaways
- Decimals like , , have simple fractional equivalents (, , ) that often make mental math easier.
- When multiplying by a decimal less than 1, the result will be smaller than the original number.
Common Mistakes
- Placing the decimal incorrectly (e.g., writing or ).
- Confusing with (forgetting the decimal point entirely).
Things to Be Careful About
- In non-calculator papers, converting decimals to fractions is often the safest method to avoid decimal placement errors.
Approach
To divide by a fraction, multiply by its reciprocal. The expression is .
Working
Keep the first fraction, change division to multiplication, and flip the second fraction (find the reciprocal):
Multiply the numerators together and the denominators together:
So the unsimplified result is:
Simplify the fraction by finding the highest common factor (HCF) of 12 and 45. Both are divisible by 3:
The simplified fraction is:
Answer
4/15
Walkthrough
We are asked to calculate .
- Reciprocal Rule: Dividing by a fraction is the same as multiplying by its reciprocal. The reciprocal of is . So, rewrite the problem as .
- Multiply Across: Multiply the top numbers (numerators) and the bottom numbers (denominators).
- Numerator:
- Denominator:
- Result:
- Simplify: Check if the fraction can be reduced. The factors of 12 are 1, 2, 3, 4, 6, 12. The factors of 45 are 1, 3, 5, 9, 15, 45. The largest common factor is 3. Divide both the numerator and denominator by 3.
- Final answer: .
Note: You could also simplify before multiplying by cancelling common factors between diagonals. Here, 6 and 9 share a factor of 3 (, ), leading directly to . Both methods are valid.
Key Takeaways
- To divide fractions, invert the divisor and multiply.
- Always simplify your final answer to its lowest terms.
- Cross-cancellation before multiplying can keep numbers smaller and reduce errors.
Common Mistakes
- Multiplying straight across without flipping the second fraction (i.e., calculating ).
- Forgetting to simplify the final fraction (leaving it as ).
- Incorrectly multiplying mixed numbers or whole numbers with fractions (not applicable here but common in similar questions).
Things to Be Careful About
- Ensure the question asks for the simplest form. While is mathematically equal, exams usually require the simplest form for full marks unless stated otherwise.
A bag contains 11 balls.
There are 5 blue balls and 4 yellow balls.
The rest of the balls are green.
A ball is taken from the bag at random.
Find the probability that the ball is
Approach
The probability of an event is given by the ratio:
We need to find the probability that a randomly selected ball is yellow.
Working
From the question stem:
- Total number of balls =
- Number of yellow balls =
The number of favourable outcomes (picking a yellow ball) is .
The total number of possible outcomes is .
Substituting these values into the formula:
Answer
4/11
Walkthrough
To find the probability of picking a yellow ball, we use the basic definition of probability for a single event. This is the number of balls that are yellow divided by the total number of balls in the bag. The problem states there are 4 yellow balls out of a total of 11 balls. Therefore, the probability is simply the fraction .
Key Takeaways
- Probability is always a number between 0 and 1.
- For equally likely outcomes, , where is the number of outcomes in event A and is the total number of outcomes.
- The denominator represents the total sample space.
Common Mistakes
- Swapping the numerator and denominator (writing ).
- Using the wrong count for the numerator (e.g., using the number of green or blue balls instead of yellow).
- Not reducing the fraction if it can be simplified (though is already in its simplest form).
Things to Be Careful About
- Ensure you use the correct total from the stem (), not just the sum of the parts mentioned in the specific part question.
- The answer should be left as a fraction unless decimals are requested.
Approach
We need to find the probability that the ball is not blue. There are two ways to do this:
- Count the number of balls that are not blue and divide by the total.
- Use the complement rule: .
Working
Method 1: Counting favourable outcomes
The balls that are not blue are the yellow ones and the green ones.
- Number of yellow balls =
- Number of green balls: The rest of the 11 balls are green.
- Total non-blue balls = Yellow + Green = .
Alternatively, simply subtract the blue balls from the total:
Total outcomes = .
Method 2: Complement Rule
Answer
6/11
Walkthrough
The event "not blue" includes all outcomes except those where the ball is blue. Since the only colours are blue, yellow, and green, the non-blue balls are the yellow and green ones. We know there are 5 blue balls out of 11. So, the number of non-blue balls is . The probability is therefore . Alternatively, one could calculate .
Key Takeaways
- The probability of an event NOT happening is minus the probability of it happening.
- Mutually exclusive events (like being blue vs being not blue) cover the entire sample space, so their probabilities sum to 1.
Common Mistakes
- Calculating the probability of being green instead of not blue.
- Forgetting that "not blue" includes both yellow AND green balls.
- Arithmetic errors when subtracting fractions from 1.
Things to Be Careful About
- Read the question carefully: "not blue" is different from "green".
- Verify that the counts add up: . This confirms the total is correct.
The area of one face of a cube is .
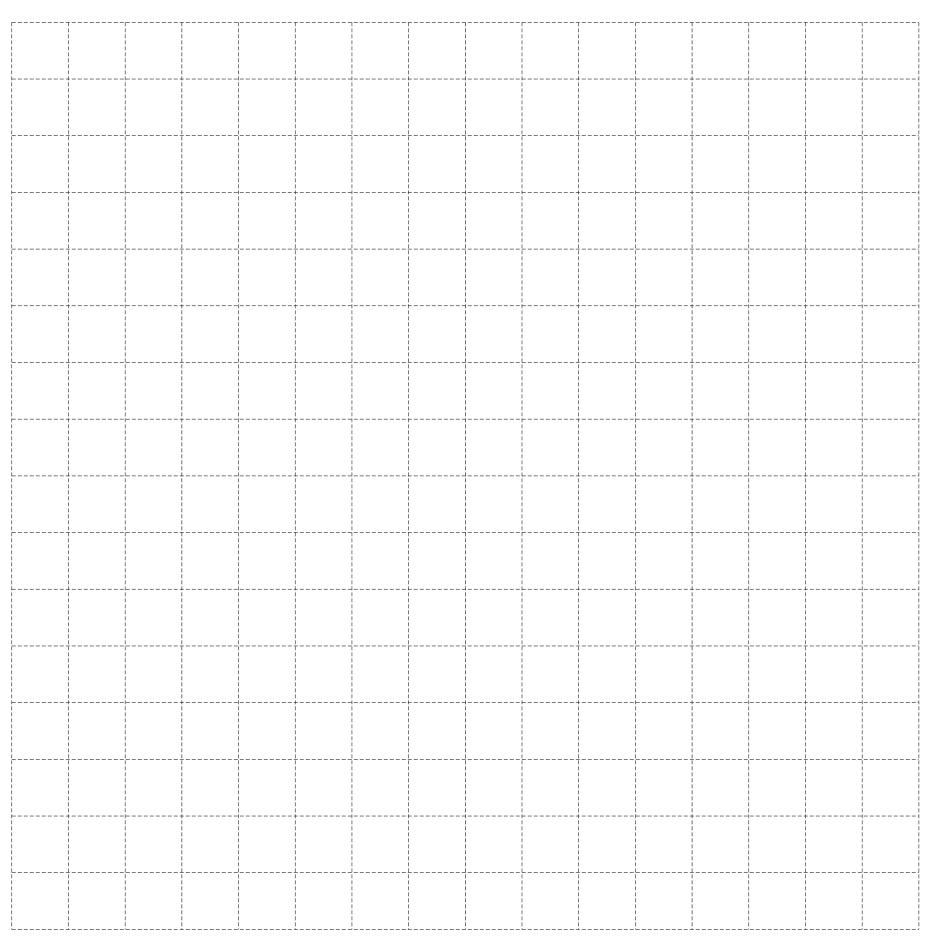
On the grid, draw an accurate net of the cube.
Approach
First, determine the side length of each face of the cube from the given area. Then, use the grid scale to draw a valid net consisting of six squares.
Working
The area of one face (a square) is given as .
Since the grid is per square, each face of the cube must be drawn as a block of grid squares.
A cube has 6 faces. A valid net must consist of 6 squares connected edge-to-edge in a pattern that can fold into a cube. A common valid net is a cross shape: a horizontal row of 4 squares, with one square attached above the second square and one square attached below the second square.
Answer
A net of a cube drawn on the grid, consisting of 6 squares each measuring grid units, arranged in a valid net configuration (e.g., a cross shape), with internal fold lines drawn.
Net of a cube with 6 squares of size 3x3 grid units, e.g., a cross shape (4 in a row, 1 above and 1 below the second square), with internal fold lines.
Walkthrough
- Find the side length: The problem states the area of one face is . Since a face of a cube is a square, its area is . Solving gives .
- Determine the grid scale: The grid provided is per square. Therefore, each side of the cube's face must span exactly 3 grid squares. Each face is a block.
- Construct the net: A cube has 6 identical square faces. A net is a 2D pattern that can be folded to form the 3D shape. There are 11 distinct nets for a cube. A simple and common one is the 'cross' or 'T' shape. For example, draw a horizontal row of four squares. Then, draw a fifth square attached to the top edge of the second square in the row, and a sixth square attached to the bottom edge of the same second square.
- Internal lines: The marking scheme notes that 'no/incorrect internal lines' reduces the mark to 2. Internal lines represent the folds where the net will be joined. These should be drawn clearly between the adjacent squares.
Key Takeaways
- The side length of a square is the square root of its area: .
- A net of a cube always consists of exactly 6 squares.
- When drawing on a grid, always convert the required dimensions into grid units using the given scale.
Common Mistakes
- Wrong scale: Drawing squares that are (ignoring the area) or (confusing area with side length).
- Invalid net: Drawing 6 squares that do not connect in a way that can fold into a cube (e.g., a block is not a valid net, nor is a row of 6 squares).
- Missing internal lines: Forgetting to draw the lines between the squares that indicate folds, which the mark scheme penalises.
- Inaccuracy: Not aligning the squares perfectly to the grid lines, resulting in a net that is not 'accurate'.
Things to Be Careful About
- Accuracy: The question asks for an 'accurate' net. Ensure all lines are straight and follow the grid exactly. Each face must be exactly grid squares.
- Mark scheme guidance: Full marks (3) require a correct net with edge length and correct internal lines. An open net (5 squares) or missing internal lines only scores 2 marks. A single square of the correct size scores 1 mark.
- Units: The grid is in cm, and the calculated side is in cm, so no unit conversion is needed for the drawing, but be aware if the grid scale were different.
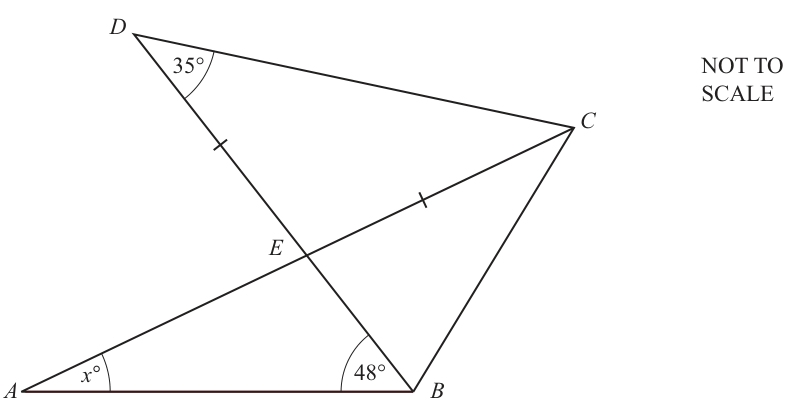
and are straight lines.
.
Find the value of .
= ______
Approach
Use the properties of an isosceles triangle to find the angles in triangle DEC. Then use vertically opposite angles to find an angle in triangle AEB, and finally use the angle sum of a triangle to find .
Working
In triangle DEC, , so it is an isosceles triangle. The base angles are equal:
The sum of angles in triangle DEC is :
Since AEC and BED are straight lines intersecting at , and are vertically opposite angles. Vertically opposite angles are equal:
In triangle AEB, the sum of angles is :
Answer
22
Walkthrough
First, we look at triangle DEC. We are given that , which means triangle DEC is an isosceles triangle. In an isosceles triangle, the angles opposite the equal sides are equal. Therefore, .
Next, we use the fact that the angles in any triangle add up to . So in triangle DEC, .
Now we move to the intersection at . The lines AEC and BED are straight lines, which means and are vertically opposite angles. Vertically opposite angles are equal, so . (Alternatively, and are angles on a straight line BED, so , and then using angles on straight line AEC).
Finally, we look at triangle AEB. We know two of its angles: and . The third angle is . Since the angles in a triangle add up to , we have , which gives .
Key Takeaways
- Isosceles triangles have two equal base angles opposite the equal sides.
- Vertically opposite angles formed by two intersecting straight lines are equal.
- The sum of angles in any triangle is always .
Common Mistakes
- Forgetting that the base angles of an isosceles triangle are equal, and instead assuming the apex angle is .
- Not recognising vertically opposite angles and instead trying to use angles on a straight line incorrectly.
- Forgetting to subtract the sum of the two known angles from to find .
Things to Be Careful About
- The diagram is marked "NOT TO SCALE", so do not measure angles with a protractor.
- Ensure you correctly identify which angles are equal in the isosceles triangle (the base angles, not the apex angle).
- Keep track of degrees and do not forget the degree symbol when writing angle values, though itself is just a number.
Solve.
= ______
Approach
Expand the brackets to remove the parentheses, then rearrange the equation to isolate .
Working
Start with the given equation:
Expand the brackets (multiply each term inside by 5):
Subtract 20 from both sides to move the constant term:
Simplify the right-hand side:
Divide both sides by -5 to solve for :
Calculate the final value:
Answer
-3
Walkthrough
The problem asks us to solve for in the equation . The first step is to simplify the left-hand side. We can do this by 'expanding the brackets', which means multiplying the number outside () by each term inside the brackets ( and ). This gives . Now the equation is . To get on its own, we need to move the to the other side. We do this by subtracting from both sides, resulting in . Finally, since is multiplied by , we divide both sides by to find the value of . Dividing a positive number () by a negative number () results in a negative answer ().
Key Takeaways
- Expanding Brackets: Always distribute the multiplier to every term inside the parentheses.
- Inverse Operations: Use addition/subtraction to move constants and multiplication/division to isolate variables.
- Sign Rules: Remember that a positive divided by a negative yields a negative result.
Common Mistakes
- Forgetting to multiply the second term inside the bracket (e.g., writing instead of ).
- Sign errors when moving terms across the equals sign (e.g., adding 20 instead of subtracting).
- Incorrectly dividing signs (e.g., thinking ).
Things to Be Careful About
- Ensure you maintain the negative sign attached to the term throughout the working.
- Check your answer by substituting back into the original equation: . This confirms the solution is correct.
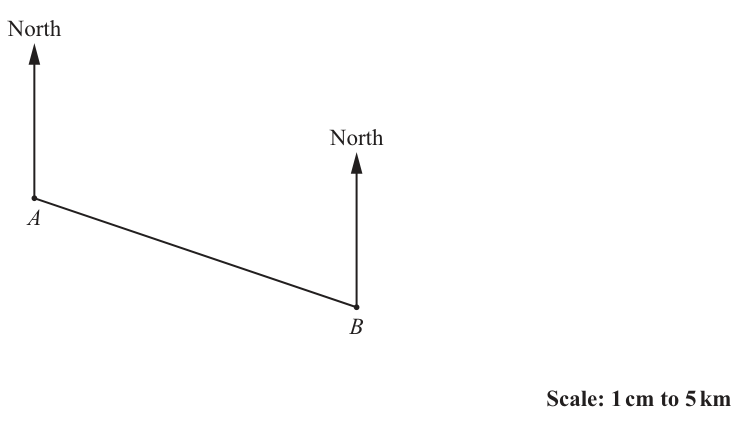
The scale drawing shows the positions of two villages, and .
The scale is to .
Approach
Measure the length of the line segment on the scale drawing using a ruler. Then multiply this length by the scale factor to find the actual distance in kilometres.
Working
Measure the length of on the drawing. The acceptable measured length is between and . Assume a measured length of for this working.
Any answer in the range to is accepted based on the measured length.
Answer
(accept to )
30
Walkthrough
First, use a ruler to measure the length of the line segment connecting and on the provided scale drawing. Because the drawing is printed at a specific size, small measurement variations are expected, so any value between and is considered correct. Next, apply the scale ratio. The scale is to , meaning every centimetre on the drawing represents in reality. Multiply the measured length by to convert to kilometres. For example, .
Key Takeaways
- Always measure lengths on scale drawings with a ruler.
- To convert a measured distance to an actual distance, multiply by the scale factor (the real-world distance per unit of drawing distance).
- Acceptable measurement tolerances are given in the mark scheme; answers within this range are valid.
Common Mistakes
- Forgetting to multiply by the scale factor and giving the answer in centimetres.
- Multiplying by the wrong number (e.g., dividing by 5 instead of multiplying).
- Not accepting the tolerance range for the measured length.
Things to Be Careful About
- Ensure the ruler is aligned exactly with the line segment and read the measurement to the nearest millimetre.
- The final answer must be in kilometres, not centimetres.
- The mark scheme allows a range of answers ( to ) due to measurement tolerance; any value in this range earns full marks.
Village is on a bearing of from village .
Village is on a bearing of from village .
Find and label the position of village on the scale drawing.
Approach
To find the position of village , draw two rays from villages and using the given bearings. The intersection of these two rays will be the location of village .
Working
- At village , the North arrow is already drawn. Measure and draw a ray at a bearing of (which is clockwise from the North line at ).
- At village , the North arrow is already drawn. Measure and draw a ray at a bearing of (which is clockwise from the North line at , or equivalently counter-clockwise from North).
- Mark the point where these two rays intersect and label it .
Answer
Village is located at the intersection of the ray from at a bearing of and the ray from at a bearing of . See diagram.
Point C at the intersection of the 060° bearing from A and the 320° bearing from B
Walkthrough
A bearing is an angle measured clockwise from the North line.
First, consider village . The North arrow is already provided. A bearing of means we measure clockwise from the North line at and draw a ray extending from in that direction.
Next, consider village . The North arrow is also provided here. A bearing of means we measure clockwise from the North line at . Since a full circle is , this is equivalent to measuring counter-clockwise (or to the left) from the North line at . Draw a ray extending from in this direction.
The position of village must satisfy both conditions simultaneously, so it must lie on both rays. Mark the point where these two rays intersect and label it .
Key Takeaways
- Bearings are always measured clockwise from the North line.
- When constructing a point from two bearings, draw rays from both reference points and find their intersection.
- North lines at different points on a scale drawing are parallel to each other.
Common Mistakes
- Measuring the bearing counter-clockwise instead of clockwise.
- Measuring from the wrong reference line (e.g., from the line instead of the North line).
- Forgetting that North lines at different points are parallel and should be drawn vertically upwards at each point.
Things to Be Careful About
- Ensure the protractor is aligned correctly with the North line at each village.
- Bearings must be given as three figures (e.g., , not ).
- The intersection point must be clearly marked and labeled .
Evaluate.
Approach
Find the number which, when multiplied by itself three times, gives 125.
Working
We are looking for such that:
Checking small integers:
Thus:
Answer
5
Walkthrough
The question asks to evaluate the cube root of 125. This means we need to find a number that, when cubed (multiplied by itself twice more), equals 125. We know that , and . Therefore, the cube root is 5.
Key Takeaways
- The cube root of a number is the value such that .
- Common cubes to memorize include , , , and .
Common Mistakes
- Confusing square roots with cube roots (e.g., thinking of ).
- Arithmetic errors in multiplication.
Things to Be Careful About
- Ensure you are calculating the correct root index. Here it is 3, not 2.
Approach
Use the negative index law to rewrite the expression with a positive exponent, then calculate the value.
Working
The expression is:
Apply the negative index law:
Calculate the denominator:
So:
Alternatively, as a decimal:
Answer
1/16
Walkthrough
The problem asks to evaluate . A negative exponent indicates the reciprocal of the base raised to the positive version of that exponent. The rule is .
Step 1: Rewrite as .
Step 2: Calculate , which is .
Step 3: Combine to get . This can also be written as the decimal .
Key Takeaways
- Negative indices represent reciprocals: .
- Always convert to a positive index first before calculating if it helps avoid sign errors.
Common Mistakes
- Calculating instead of .
- Forgetting to take the reciprocal (writing or just ).
- Arithmetic error in squaring 4.
Things to Be Careful About
- The mark scheme accepts both the fraction and the decimal . Ensure your final answer is in an exact form.
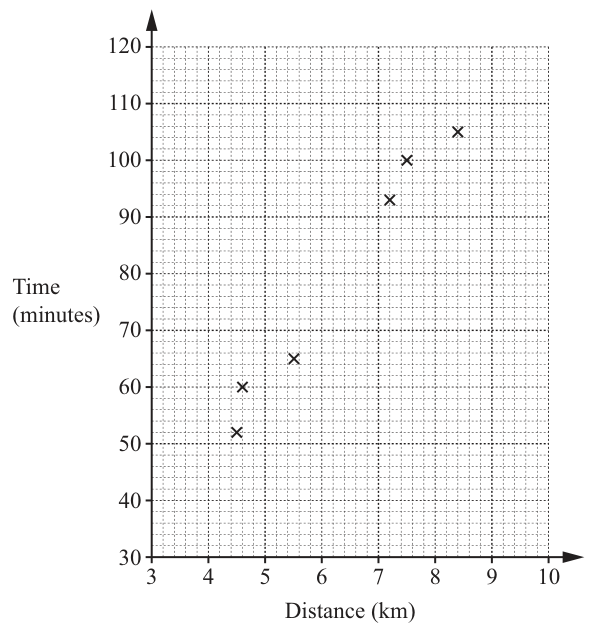
Asha records the distance she walks and the time she takes for each of 10 walks.
The table shows her results.
| Distance (km) | 4.5 | 4.6 | 7.2 | 8.4 | 5.5 | 7.5 | 4.2 | 9.0 | 3.8 | 5.6 |
|---|---|---|---|---|---|---|---|---|---|---|
| Time (minutes) | 52 | 60 | 93 | 105 | 65 | 100 | 52 | 116 | 49 | 62 |
Approach
Identify the four data pairs that have not yet been plotted on the scatter diagram and mark them as crosses at the correct coordinates.
Working
The complete list of (Distance, Time) pairs is:
(4.5, 52), (4.6, 60), (7.2, 93), (8.4, 105), (5.5, 65), (7.5, 100), (4.2, 52), (9.0, 116), (3.8, 49) and (5.6, 62).
The first six are already plotted. The four remaining points to plot are:
Locate each of these on the grid and mark with a cross.
Answer
Four points correctly plotted at (4.2, 52), (9.0, 116), (3.8, 49) and (5.6, 62).
Four points plotted at (4.2, 52), (9.0, 116), (3.8, 49) and (5.6, 62)
Walkthrough
The table provides 10 (Distance, Time) pairs. The scatter diagram already shows six of these points. To complete the diagram, we simply read off the remaining four pairs from the table and plot them at the corresponding coordinates on the grid.
The missing pairs are:
- Distance , Time
- Distance , Time
- Distance , Time
- Distance , Time
For each pair, move along the horizontal axis to the distance value, then move up to the time value, and place a cross. For example, for , go to on the Distance axis and on the Time axis.
Key Takeaways
A scatter diagram is completed by plotting every data pair from the table. The horizontal axis represents the independent variable (Distance) and the vertical axis represents the dependent variable (Time).
Common Mistakes
- Reading the axes in the wrong order (plotting Time on the horizontal axis and Distance on the vertical axis).
- Misreading the minor gridlines: the horizontal axis has major lines at every and minor lines at every ; the vertical axis has major lines at every and minor lines at every .
- Forgetting to plot a point entirely.
Things to Be Careful About
Ensure each point is plotted to the correct minor gridline. For instance, is four minor gridlines to the right of , and is four and a half minor gridlines above . Accuracy here is essential for part (b).
Approach
Draw a straight ruled line that passes through the centre of the data pattern, with roughly equal numbers of points above and below the line.
Working
A straight line of best fit is drawn through the plotted points. The line should have a positive gradient, reflecting the positive correlation between distance and time. It should not necessarily pass through every point, but should balance the points on either side. For example, a line passing near and is appropriate.
Answer
A straight ruled line of best fit with a positive gradient drawn through the data points.
A straight ruled line of best fit with a positive gradient drawn through the data points
Walkthrough
A line of best fit summarises the trend in the scatter diagram. Since time increases as distance increases, the line must have a positive gradient.
Draw a straight ruler line through the middle of the cloud of points. The key criteria are:
- The line must be straight and ruled (not freehand).
- It must show the positive trend (going up from left to right).
- There should be roughly equal numbers of points above and below the line.
- The line should extend across the range of the data.
Key Takeaways
The line of best fit is a visual summary of the relationship between two variables. It is used to estimate values within the range of the data (interpolation).
Common Mistakes
- Drawing a curved line instead of a straight ruled line.
- Forcing the line to pass through the origin , which is not appropriate here.
- Not using a ruler, resulting in a wobbly line.
Things to Be Careful About
The line must be straight and ruled. In part (c), any estimate must be read from this specific line, so the candidate's line determines the acceptable answer range. The line must have a positive gradient.
Asha goes for another walk.
She walks a distance of .
Use your line of best fit to estimate the time Asha takes for this walk.
______
Approach
Locate on the horizontal axis, move vertically up to the line of best fit, then move horizontally to read the corresponding time on the vertical axis.
Working
- Find on the Distance (horizontal) axis. This is four minor gridlines to the left of .
- Move vertically upwards from until you meet the line of best fit.
- From that intersection point, move horizontally to the left to read the value on the Time (vertical) axis.
Using a typical line of best fit passing near and :
At :
Reading from the graph, the time is approximately to . A value such as is acceptable.
Answer
87
Walkthrough
We are asked to estimate the time for a walk of using the line of best fit drawn in part (b).
- Locate on the horizontal Distance axis. Since the major gridlines are at every and minor at every , is four minor gridlines to the left of .
- Draw a vertical line up from until it intersects the line of best fit.
- From that intersection, draw a horizontal line to the left to read the value on the vertical Time axis.
The exact reading depends on the specific line of best fit the candidate drew, but it should be around to . The mark scheme accepts any reasonable reading from a valid line of best fit with a positive gradient.
Key Takeaways
A line of best fit can be used to interpolate (estimate) values within the range of the data. Always read from the line of best fit, not from the raw data points.
Common Mistakes
- Reading the value from a raw data point instead of the line of best fit.
- Reading the axes in the wrong order (reading distance from the vertical axis).
- Not drawing the vertical and horizontal guide lines clearly, leading to an inaccurate reading.
Things to Be Careful About
The answer is dependent on the candidate's line of best fit. Any reading between and is likely to be accepted, provided it comes from a straight line with a positive gradient. Give the answer as a whole number of minutes.
The diagram shows a rectangle.
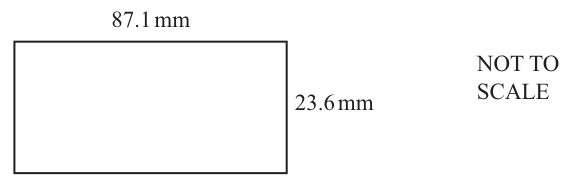
By writing each number correct to 1 significant figure, find an estimate for the area of the rectangle.
______
Approach
Round each given dimension to 1 significant figure, then multiply the rounded values to estimate the area.
Working
The length is . Rounding to 1 significant figure:
The width is . Rounding to 1 significant figure:
Estimated area:
Answer
1800
Walkthrough
The question asks for an estimate of the area by rounding the dimensions to 1 significant figure first.
The length is . The first significant figure is 8, and the next digit is 7, so we round up to .
The width is . The first significant figure is 2, and the next digit is 3, so we round down to .
Multiply the rounded values:
The estimated area is .
Key Takeaways
- Rounding to 1 significant figure means keeping the first non-zero digit and replacing the rest with zeros (or using decimal places if the number is less than 1).
- Estimation by rounding simplifies calculations and gives a quick approximate answer.
Common Mistakes
- Rounding to 1 decimal place instead of 1 significant figure (e.g., and ).
- Multiplying the original values instead of the rounded values when an estimate is requested.
Things to Be Careful About
- 1 significant figure is not the same as 1 decimal place. For , 1 s.f. is , not . For , 1 s.f. is , not .
- Ensure you are multiplying the rounded values, not the original values, as the question specifically asks for an estimate using rounded numbers.
Approach
Divide 228 by prime numbers until only primes remain, then write the factors as a product.
Working
228 is even, so divide by 2:
114 is even, so divide by 2 again:
57 is divisible by 3:
19 is prime, so the division stops. Therefore:
2^2 × 3 × 19
Walkthrough
Start with the smallest prime, 2, because 228 is even. Dividing by 2 gives 114. Since 114 is still even, divide by 2 again to get 57. 57 is not divisible by 2, so try the next prime, 3: . 19 is prime, so the factorisation is complete. The prime factors are , which can be written more compactly as .
Key Takeaways
This question tests prime factorisation: breaking a number into a product of primes. It also shows how repeated factors can be collected using index notation.
Common Mistakes
- Stopping before reaching a prime, e.g. leaving or .
- Missing the prime 19.
- Writing a composite factor such as 6 or 57 in the final product.
- Forgetting that the order of factors does not matter, but the product must contain only primes.
Things to Be Careful About
- Continue dividing until the quotient is prime.
- On the non-calculator component, show the divisions clearly so the method mark is visible.
- The mark scheme accepts either or .
Approach
Since , square the prime factorisation from part (a) by doubling each index.
Working
From part (a), . Squaring:
2^4 × 3^2 × 19^2
Walkthrough
Use the fact given in the question: . Instead of factorising 51984 from scratch, take the prime factorisation of 228 from part (a) and square it. When a product is squared, every factor is squared, so each exponent doubles: becomes , becomes , and becomes . This gives .
Key Takeaways
Squaring a number squares each prime factor, so the exponents in its prime factorisation are doubled. This links prime factorisation with the index law .
Common Mistakes
- Squaring the bases instead of the exponents, e.g. writing .
- Forgetting to square the primes 3 and 19.
- Trying to factorise 51984 from scratch instead of using the given square and part (a).
Things to Be Careful About
- The answer follows through from part (a): if part (a) were wrong, the mark scheme allows follow-through by squaring each term of the candidate's product.
- Keep the product in prime factor form; do not multiply it out unless asked.
- On the non-calculator component, the working should show the index doubling clearly.
The mass of a small box is .
The mass of a large box is .
Approach
Translate the given statement about the total mass into an equation involving and . Then simplify this equation to match the required form.
Working
The mass of 4 small boxes is kg.
The mass of 6 large boxes is kg.
The total mass is given as 30 kg. Therefore:
Divide every term in the equation by 2:
This simplifies to:
This matches the expression we were asked to show.
Answer
The derived equation is .
2x + 3y = 15
Walkthrough
First, we convert the words into math. We have 4 boxes of type , so that's . We have 6 boxes of type , so that's . Together they weigh 30 kg, so we write . The question asks us to 'show' a specific simplified version. To get from to , we notice that all numbers (4, 6, and 30) can be divided by 2. Dividing the whole equation by 2 gives us the target result.
Key Takeaways
- Translating 'total', 'sum', or 'is' into an equals sign.
- Simplifying linear equations by dividing through by the highest common factor.
Common Mistakes
- Writing the equation with incorrect coefficients (e.g., swapping 4 and 6).
- Forgetting to divide the constant term (30) when simplifying.
- Not showing the initial unsimplified equation (), which is often where the mark is awarded for this type of 'show that' question.
Things to Be Careful About
- Ensure you are answering exactly what is asked: here it is to 'show' the simplified form, so your final line must explicitly state .
The total mass of 6 small boxes and 1 large box is .
Use this information to write down an equation in terms of and .
______
Approach
Identify the number of each type of box and their combined mass to form a second equation.
Working
The mass of 6 small boxes is kg.
The mass of 1 large box is (or simply ) kg.
The total mass is given as 13 kg. Therefore:
Answer
6x + y = 13
Walkthrough
This part follows the same logic as part (a). We have 6 small boxes () and 1 large box (). Their sum is 13. So, we simply write . No simplification is needed or asked for.
Key Takeaways
- Being able to quickly form the second equation in a simultaneous equations problem.
Common Mistakes
- Writing instead of (forgetting the variable ).
- Using the wrong total mass (e.g., using 30 from part a).
Things to Be Careful About
- Check that the coefficients match the text exactly: 6 small, 1 large.
Solve the simultaneous equations to find the mass of a small box and the mass of a large box.
You must show all your working.
Small box = ______
Large box = ______
Approach
We now have a system of two simultaneous equations:
We will use the elimination method. We will multiply the second equation by 3 so that the terms match, then subtract to eliminate .
Working
Equation (1):
Equation (2):
Multiply Equation (2) by 3:
Subtract Equation (1) from Equation (3):
Solve for :
Substitute into Equation (2) to find :
Check with Equation (1): . This is correct.
Answer
Small box = kg
Large box = kg
Small box = 1.5 kg, Large box = 4 kg
Walkthrough
We start with the two equations found in the previous parts. To solve them, we need to remove one variable. Looking at and , it is easy to make the terms match by multiplying the second equation by 3. This gives . Now both equations have . Subtracting the first equation from this new one removes the 's, leaving an equation with only : . Solving this gives . Finally, plug back into one of the original equations (the simpler one, ) to find . is 9, so , meaning .
Key Takeaways
- The elimination method works best when coefficients are multiples of each other.
- Always substitute your answer back into an equation to verify it works.
Common Mistakes
- Subtracting the constants incorrectly (e.g., calculated wrongly).
- Substituting the value of into the wrong equation or making an arithmetic error during substitution.
- Failing to show the working for the elimination step (M1 mark requires visible scaling/subtraction).
Things to Be Careful About
- The mark scheme awards marks for the method (M1) and the answers (A2/A1). Even if the final answer is wrong, showing the correct elimination process earns partial credit.
- Ensure units (kg) are included in the final answer if required by the format.
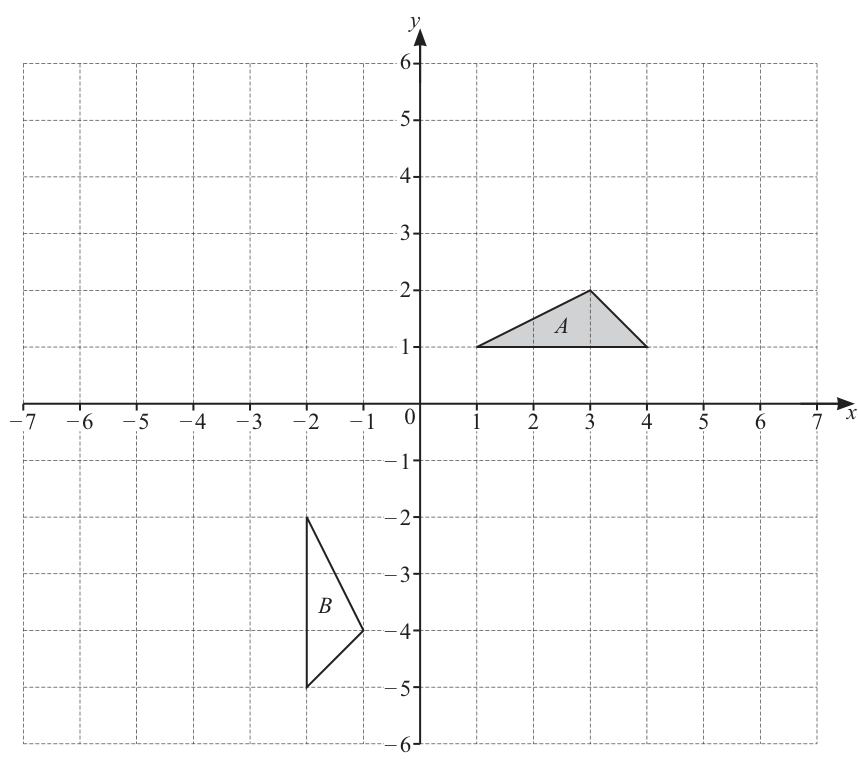
Triangle and triangle are drawn on the grid.
Approach
To describe the transformation fully, we need the type of transformation, the angle (if rotation), and the centre (if rotation or enlargement). We test mapping the vertices of triangle to triangle and find the fixed point (centre) and the angle.
Working
Triangle has vertices at , and . Triangle has vertices at , and .
Join corresponding vertices: to , and to . The perpendicular bisectors of these join lines intersect at the centre of rotation.
Midpoint of and is . The slope of the join line is , so the perpendicular bisector has slope :
Midpoint of and is . The slope of the join line is , so the perpendicular bisector also has slope :
Both bisectors lie on the line . Testing the point :
So the centre is . Checking the angle: the vector from to is . The vector from to is . This is a clockwise rotation.
Answer
Rotation 90° clockwise about (-2, 1)
Walkthrough
To find the single transformation mapping triangle onto triangle , we first observe that the orientation has changed in a way consistent with a rotation. We join corresponding vertices and construct their perpendicular bisectors to find the centre of rotation. The join line from to has a midpoint of and a gradient of , giving a perpendicular bisector of . The join line from to has a midpoint of and the same gradient of , giving the same perpendicular bisector . Any point on this line is a candidate for the centre. Testing , we see it lies on the line. To confirm it is the centre, we check the vectors from to the original vertex which is , and to the image vertex which is . The vector rotated clockwise gives , confirming the transformation is a rotation of clockwise about .
Key Takeaways
A single rotation is fully described by its centre, angle, and direction. The centre can be found by intersecting the perpendicular bisectors of the lines joining corresponding vertices of the object and its image.
Common Mistakes
- Forgetting to state the direction of rotation (clockwise vs anticlockwise).
- Giving the centre incorrectly, often by misreading the grid coordinates.
- Describing the transformation as a reflection or translation when the orientation clearly indicates rotation.
Things to Be Careful About
A full description of a rotation requires three pieces of information: the type (rotation), the angle (), and the centre . Omitting any one of these will cost marks. Always verify the centre by checking the distance from the centre to corresponding vertices is equal.
Approach
Reflect each vertex of triangle in the line . For a vertical line , the -coordinate is unchanged and the new -coordinate is .
Working
The line of reflection is .
- Vertex : new . Image is .
- Vertex : new . Image is .
- Vertex : new . Image is .
Draw the triangle with vertices at , and on the grid.
Answer
Triangle with vertices at , and .
Triangle with vertices at (-6, 1), (-3, 1) and (-5, 2)
Walkthrough
To reflect triangle in the line , we keep the -coordinates the same and calculate the new -coordinates. The distance from each vertex to the line is measured horizontally, and the image is placed the same distance on the opposite side.
- For , the distance to is units to the right. The image is units to the left: . So .
- For , the distance is units to the right. The image is units to the left: . So .
- For , the distance is units to the right. The image is units to the left: . So .
Draw and label the new triangle on the grid.
Key Takeaways
Reflection in a vertical line leaves unchanged and maps to . The shape and size remain the same, but the orientation is reversed.
Common Mistakes
- Forgetting to change the sign of the distance from the line of reflection.
- Drawing the triangle in the wrong position or with incorrect dimensions.
Things to Be Careful About
The answer must be drawn on the grid. Ensure the vertices are plotted exactly at the calculated coordinates and the triangle is closed and labelled clearly.
Triangle is enlarged with scale factor and centre .
Triangle is the image of triangle after the enlargement.
The coordinates of one vertex of triangle are .
Approach
Under an enlargement with centre and scale factor , a point maps to . We use the given vertex of and its corresponding vertex of to find .
Working
The vertices of triangle are , and . One vertex of triangle is .
Testing each vertex of multiplied by a scale factor :
- If , this cannot be since .
- If , setting gives , and gives . This matches.
- If , this would be for .
So the scale factor is .
Answer
3
Walkthrough
An enlargement with centre and scale factor maps any point to . We are given that one vertex of the image triangle is . We test the vertices of triangle to see which one maps to when multiplied by .
- . For this to be , we would need and , which is impossible.
- . Setting gives . Checking the -coordinate: , which matches the -coordinate of .
- . For , this is , which is not .
Thus, the vertex of maps to of , and the scale factor is .
Key Takeaways
For an enlargement from the origin, the scale factor is the ratio of any coordinate of the image to the corresponding coordinate of the object: .
Common Mistakes
- Trying to match the wrong vertices (e.g., assuming maps to ).
- Calculating incorrectly by dividing in the wrong order (object divided by image instead of image divided by object).
Things to Be Careful About
The scale factor must be consistent for both and coordinates. Always verify by checking both coordinates of the matched vertex pair.
Find the coordinates of the other two vertices of triangle .
( ______ , ______ ) and ( ______ , ______ )
Approach
Using the scale factor and centre , multiply the coordinates of the remaining vertices of triangle by to find the corresponding vertices of triangle .
Working
The vertices of triangle are , and . We already know .
- Vertex : .
- Vertex : .
Answer
(3, 3) and (9, 6)
Walkthrough
We have determined that the scale factor for the enlargement is with centre . To find the other two vertices of triangle , we simply multiply the coordinates of the remaining vertices of triangle by .
- The vertex maps to .
- The vertex maps to .
These are the coordinates of the other two vertices of triangle .
Key Takeaways
Once the scale factor is known, applying the enlargement to all vertices is a straightforward multiplication of each coordinate by the scale factor.
Common Mistakes
- Forgetting to multiply both the and coordinates.
- Using the wrong scale factor or centre of enlargement.
- Arithmetic errors in simple multiplication.
Things to Be Careful About
Ensure both coordinates are multiplied by . The answer format requires two coordinate pairs. Check that the coordinates are written as .
In a sale, a shop reduces all prices by 20%.
Approach
The sale price is the original price minus the discount. Since all prices are reduced by 20%, the discount is 20% of the original price.
Working
The discount is:
So the sale price is:
Answer
The sale price of the coat is $68.
68 dollars
Walkthrough
The shop reduces all prices by 20%, so the customer pays 100% - 20% = 80% of the original price. The coat originally costs $85. First find the amount removed: 20% of 85 is . Then subtract this discount from the original price: . So the sale price is $68. This matches the mark scheme: M1 for the discount calculation, and the final answer is $68.
Key Takeaways
- A percentage reduction means subtracting the percentage of the original amount.
- 20% can be written as or 0.2.
- The sale price is the original price minus the discount.
Common Mistakes
- Using 20 as the discount instead of 20% of 85 = 17, giving 85 - 20 = 65.
- Stopping after finding the discount (17); the question asks for the sale price, so subtract from 85. The mark scheme gives B1 for 17 but not full marks.
- On the non-calculator paper, the fraction multiplication must be shown by hand.
Things to Be Careful About
- The percentage is applied to the original price, not to another amount.
- Since this is the non-calculator paper, show and simplify to 17 by cancelling.
- The final answer should be in dollars: $68.
The sale price of a shirt is $40.
Work out the cost of the shirt before the sale.
$ ______
Approach
The sale price is after a 20% reduction, so it represents 80% of the original price. Let the original price be . Then 80% of is $40. Solve for .
Working
Let the original price be . Since the sale price is 80% of the original price:
Simplify the fraction:
Multiply both sides by :
Answer
The cost of the shirt before the sale was $50.
50 dollars
Walkthrough
The shirt's sale price is $40 after a 20% reduction. That means the $40 is 80% of the original price, not 100%. Let the original price be . Write 80% as , so the equation is . Simplify to . Then multiply both sides by to get . So the original price was $50. This matches the mark scheme: M1 for forming the equation (or equivalent, seen or implied).
Key Takeaways
- In a reverse percentage problem, the given amount is the result after the change, so divide by the remaining percentage.
- A 20% reduction leaves 80%, so original = sale price = sale price .
- Always identify whether the given amount is before or after the percentage change.
Common Mistakes
- Multiplying 40 by 1.2 to get 48; this is a 20% increase, not the reverse of a 20% decrease.
- Multiplying 40 by 0.2 and subtracting (40 - 8 = 32); this treats 40 as the original price, but 40 is the sale price.
- Forgetting that 40 is 80% of the original, not 100%.
- Not showing the equation; the mark scheme requires M1 for the equation, seen or implied.
Things to Be Careful About
- The original price is larger than the sale price, so the answer must be greater than 40. If you get less than 40, check your method.
- On the non-calculator paper, simplify to and multiply by hand: .
- The final answer should be in dollars: $50.
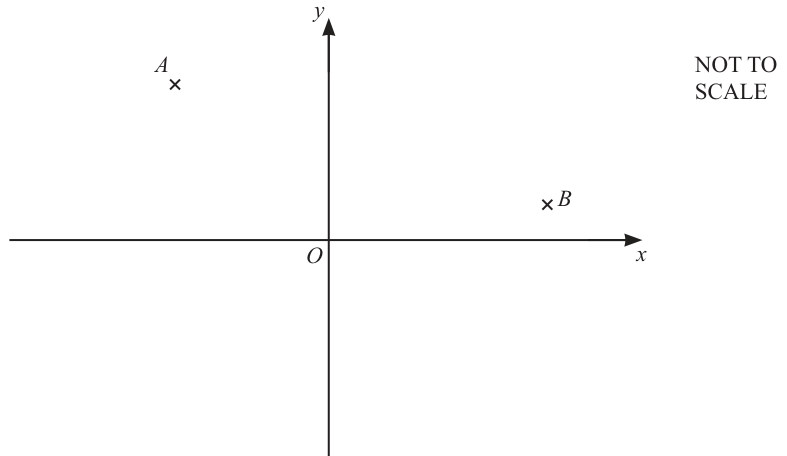
is the point and is the point .
Approach
To find the column vector , subtract the position vector of from the position vector of :
Working
The position vectors of and are:
Calculate :
Answer
(10, -4)
Walkthrough
To go from point to point , we determine the horizontal and vertical displacements:
- The horizontal movement (-component) is the final -coordinate minus the initial -coordinate:
- The vertical movement (-component) is the final -coordinate minus the initial -coordinate:
Writing these as a column vector gives .
Key Takeaways
- For any two points and , the column vector is given by .
Common Mistakes
- Subtracting in the wrong direction (calculating instead of ), which leads to .
- Sign errors when subtracting negative numbers, e.g., writing instead of .
Things to Be Careful About
- Ensure the answer is written as a column vector with top and bottom components, not as a coordinate or fraction.
Approach
To find the coordinates of , calculate the position vector by adding the vector to the position vector of :
Working
Given and :
Therefore, the coordinates of are .
Answer
(3, -3)
Walkthrough
The vector represents the movement from point to point .
- Add the -displacement to the -coordinate of : .
- Add the -displacement to the -coordinate of : .
This gives the coordinates of as .
Key Takeaways
- A vector moves a point to a point . Hence, the position vector .
Common Mistakes
- Subtracting from instead of adding it.
- Mixing up the and components.
Things to Be Careful About
- The question asks for the coordinates of , so format the final result as a coordinate pair .
is a trapezium.
is parallel to and .
Approach
Since is a trapezium with parallel to and , the vector is in the same direction as and has half its magnitude:
To find the position vector of , use:
Working
From part (a), . Thus:
From part (b), .
Now, calculate :
Therefore, the coordinates of point are .
Answer
(-2, -1)
Walkthrough
- In the trapezium , the sides are traversed in the order . Thus, the side parallel to vector is vector .
- Since is parallel to and , the vector .
- Since point is at , going from to adds . To go backwards from to , we subtract this vector:
So has coordinates .
Key Takeaways
- In a polygon named , the order of vertices means side corresponds vectorially to , and the opposite side directed the same way is (not ).
- Parallel vectors with a known ratio of lengths are scalar multiples of each other.
Common Mistakes
- Taking , which reverses the direction and gives the wrong coordinates for .
- Adding to instead of subtracting it.
Things to Be Careful About
- Be mindful of negative signs when subtracting components, e.g., .
Approach
Use the distance formula between points and :
Then simplify the resulting surd into the form .
Working
Substitute the coordinates of and :
Simplify the surd :
Answer
Walkthrough
- Find the horizontal and vertical distances between and :
- Change in :
- Change in :
- Use Pythagoras' theorem to find the length of line segment :
- Take the square root: .
- Simplify the surd by identifying the largest square factor of , which is :
Key Takeaways
- The length of a line segment is found using .
- A surd is in its simplest form when no square factors remain inside the square root.
Common Mistakes
- Forgetting to square the negative value properly, e.g., evaluating as instead of .
- Leaving the answer unsimplified as , which loses the final mark.
- Converting to a decimal (e.g. ) instead of keeping the exact surd form requested.
Things to Be Careful About
- The question specifically states: "Give your answer as a surd in its simplest form." Exact simplified surd form is required.
Approach
Simplify each surd by extracting the largest square factor from the radicand, then subtract the resulting like surds.
Working
Now subtract:
Answer
3√7
Walkthrough
We need to simplify . Neither 175 nor 28 is a perfect square, but each has a square factor. and 25 is a perfect square, so . Similarly and 4 is a perfect square, so . Now both terms are multiples of , so we can combine them like terms: . The answer is .
Key Takeaways
The core skill is recognising the largest square factor of a number under a square root and extracting it. Once both surds share the same irrational part, they combine exactly like algebraic terms.
Common Mistakes
- Not extracting the largest square factor (e.g. writing and getting stuck).
- Forgetting that only when both and are non-negative.
- Mixing up the signs when subtracting.
Things to Be Careful About
The mark scheme awards B1 for either or , and the final answer must be exactly (cao). Ensure both surds are fully simplified before combining. This is a non-calculator component, so all working must be by hand.
Approach
Multiply the numerator and denominator by to remove the surd from the denominator.
Working
Answer
√5/5
Walkthrough
To rationalise the denominator of , we multiply the fraction by , which is equal to 1 and therefore does not change the value. The denominator becomes , and the numerator becomes . So the fraction becomes .
Key Takeaways
Rationalising a denominator means removing the surd from the bottom of a fraction. Multiplying by the surd over itself is the standard technique.
Common Mistakes
- Forgetting to multiply the numerator as well as the denominator.
- Writing the answer as instead of .
Things to Be Careful About
The answer must be exactly (cao). Do not leave the surd in the denominator.
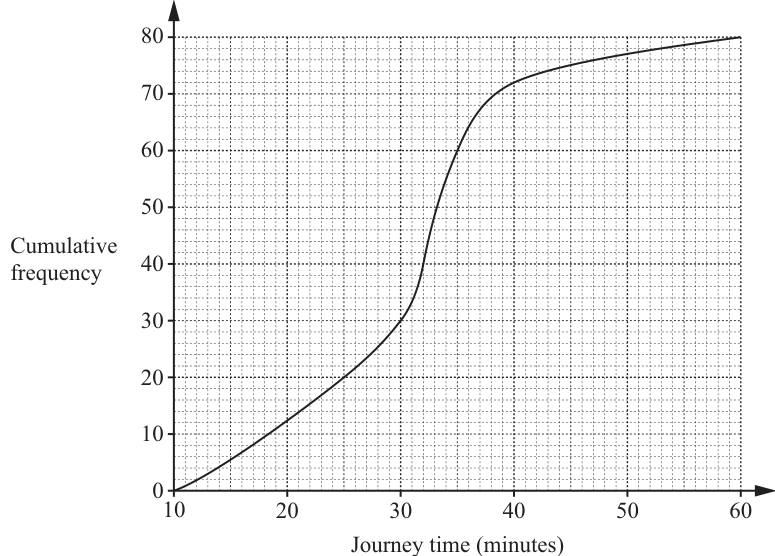
A group of 80 people each record their journey time from home to work one day.
The cumulative frequency diagram shows the results.
Use the cumulative frequency diagram to find an estimate of
Approach
The median is the value at half the total cumulative frequency. With 80 people, the median corresponds to a cumulative frequency of 40. Read this value from the horizontal axis.
Working
Total number of people = 80.
Median cumulative frequency = .
On the cumulative frequency diagram, locate 40 on the vertical axis, move horizontally to the curve, and then move vertically down to the horizontal axis.
The corresponding journey time is 32 minutes.
Answer
32
Walkthrough
The median is the middle value of a dataset. For a cumulative frequency diagram with a total frequency of 80, the median is found at cumulative frequency . By drawing a horizontal line from 40 on the vertical axis to the curve and then dropping a vertical line to the horizontal axis, we read the median journey time directly as 32 minutes.
Key Takeaways
The median on a cumulative frequency graph is always read at half the total frequency. Ensure you read the value from the correct axis (the variable axis, not the frequency axis).
Common Mistakes
- Reading the cumulative frequency value (40) as the answer instead of reading across to the curve and down to the time axis.
- Misreading the scale on the horizontal axis (each small square represents 2 minutes, not 1).
Things to Be Careful About
Always check the axis scales. Here, the horizontal axis has major divisions of 10 minutes split into 5 small squares, so each small square is 2 minutes. The answer must be in minutes.
Approach
The lower quartile (LQ) is at cumulative frequency , and the upper quartile (UQ) is at cumulative frequency . Read these values from the graph and subtract LQ from UQ to find the interquartile range.
Working
Lower quartile cumulative frequency = .
On the diagram, CF = 20 corresponds to a journey time of 25 minutes. So LQ = 25 minutes.
Upper quartile cumulative frequency = .
On the diagram, CF = 60 corresponds to a journey time of 35 minutes. So UQ = 35 minutes.
Interquartile range = UQ - LQ = minutes.
Answer
10
Walkthrough
The interquartile range (IQR) measures the spread of the middle 50% of the data. It is calculated as Upper Quartile (UQ) minus Lower Quartile (LQ).
- The LQ is at of the total frequency: . Reading across from 20 on the vertical axis to the curve and down to the horizontal axis gives 25 minutes.
- The UQ is at of the total frequency: . Reading across from 60 on the vertical axis to the curve and down to the horizontal axis gives 35 minutes.
- IQR = minutes.
Key Takeaways
LQ and UQ on a cumulative frequency graph are found at and of the total frequency, respectively. The IQR is the difference between these two values.
Common Mistakes
- Using the wrong fraction for the quartiles (e.g., using for LQ).
- Reading the frequency value (20 or 60) as the answer instead of the corresponding time value on the horizontal axis.
- Subtracting in the wrong order (LQ - UQ gives a negative number).
Things to Be Careful About
Ensure you read the time values from the horizontal axis, not the cumulative frequency values from the vertical axis. The scale on the horizontal axis has 5 small squares between each 10-minute mark, meaning each small square represents 2 minutes.
Approach
Find the cumulative frequency at a journey time of 40 minutes, then subtract this from the total number of people (80) to find how many had a journey time of 40 minutes or more.
Working
On the diagram, locate 40 on the horizontal axis, move vertically up to the curve, and then horizontally to the vertical axis.
The cumulative frequency at 40 minutes is 72.
Number of people with a journey time of 40 minutes or more = Total - CF at 40 minutes = .
Answer
8
Walkthrough
The cumulative frequency at a given value represents the number of people with a journey time up to that value. To find the number of people with a journey time of 40 minutes or more, we subtract the cumulative frequency at 40 minutes from the total number of people.
- Locate 40 on the horizontal axis (journey time).
- Move vertically up to the curve.
- Move horizontally to the vertical axis (cumulative frequency) to read the value, which is 72.
- Subtract this from the total: people.
Key Takeaways
To find the number of people above a certain value on a cumulative frequency graph, read the cumulative frequency at that value and subtract it from the total frequency.
Common Mistakes
- Reading the cumulative frequency (72) as the final answer instead of subtracting it from 80.
- Misreading the scale on the vertical axis (each small square is 2 units, so 70 is one small square above 68, making 72 one small square above 70).
Things to Be Careful About
The question asks for '40 minutes or more', which is the upper tail. Always subtract the cumulative frequency from the total for upper tail questions.
Each of the 80 people also record their journey time from work to home that day.
The table shows the results.
| Median | 35 minutes |
|---|---|
| Interquartile range | 15 minutes |
Jay says:
"The journey times from home to work are more consistent than the journey times from work to home."
Is Jay correct?
Explain how you decide.
______ because ______
Approach
Consistency of data is measured by the spread, such as the interquartile range (IQR). A smaller IQR indicates more consistent data. Compare the IQR of the journey from home to work with the IQR of the journey from work to home.
Working
From part (a)(ii), the IQR for the journey from home to work is 10 minutes.
The IQR for the journey from work to home is given as 15 minutes.
Since , the journey times from home to work have a smaller spread and are therefore more consistent.
Jay is correct.
Answer
Yes, because the IQR for the journey from home to work (10 minutes) is lower than the IQR for the journey from work to home (15 minutes).
Yes, because the IQR for the journey from home to work is lower (10 minutes compared to 15 minutes).
Walkthrough
Jay claims that the journey times from home to work are more consistent than from work to home. Consistency in statistics is indicated by a smaller spread of data, which can be measured using the interquartile range (IQR).
- From part (a)(ii), the IQR for the journey from home to work is 10 minutes.
- The table gives the IQR for the journey from work to home as 15 minutes.
- Since 10 minutes is less than 15 minutes, the home-to-work journey times are less spread out and therefore more consistent.
- Jay's statement is correct.
Key Takeaways
A lower interquartile range (IQR) indicates that the middle 50% of the data is more tightly clustered, meaning the data is more consistent.
Common Mistakes
- Comparing the medians instead of the IQRs to determine consistency. The median measures central tendency, not spread.
- Failing to explicitly state the numerical values being compared in the explanation.
Things to Be Careful About
When comparing consistency, always use a measure of spread such as the IQR or range, not the median or mean. The explanation must clearly state which value is lower and conclude accordingly.
The equation of line is .
Approach
To make the subject of the equation , we need to isolate on one side of the equation. This involves moving the term to the other side and then dividing by the coefficient of .
Working
Start with the given equation:
Subtract from both sides to move the term:
Divide every term by to isolate :
Simplify the fraction :
This can also be written as:
Answer
y = 2 - 3/5 x
Walkthrough
The goal is to write the equation in the form .
- We start with . The term containing is . To get by itself, we first remove the term. We do this by subtracting from both sides, giving . This corresponds to mark M1 for isolating or an equivalent step like dividing by 5 immediately ().
- Next, we divide the entire equation by the coefficient of , which is . This gives .
- Simplifying each term separately results in . This is the required form.
Key Takeaways
- When rearranging equations, perform inverse operations in reverse order of operations (BIDMAS/BODMAS). Here, subtraction (of ) comes before division (by ).
- Always check that the subject variable has a coefficient of .
Common Mistakes
- Forgetting to divide the term by when isolating . A common error is writing .
- Sign errors: forgetting that subtracting makes it negative on the right-hand side.
- Not simplifying the constant term ().
Things to Be Careful About
- The question asks for as the subject. Do not stop at .
- The final answer should be simplified. is preferred over unless specified otherwise, though both are often accepted as 'oe' (other equivalent). However, separating the terms makes the gradient and y-intercept clear.
Line is perpendicular to line .
Line passes through the point .
Find the equation of line .
______
Approach
Line is perpendicular to line . First, identify the gradient of line from the answer to part (a). Then, use the property that the product of gradients of perpendicular lines is to find the gradient of line . Finally, substitute the coordinates of the given point into the equation to find the y-intercept .
Working
From part (a), the equation of line is:
The gradient of line , , is .
Let be the gradient of line . Since line is perpendicular to line :
So, the equation of line is of the form:
Line passes through the point . Substitute and into the equation to find :
Calculate :
So:
Solve for :
Substitute back into the equation for line :
Answer
y = 5/3 x - 3
Walkthrough
- Find the gradient of L: From part (a), we established that line has the equation . The coefficient of is the gradient, so .
- Find the gradient of P: Perpendicular lines have gradients that are negative reciprocals of each other. If , then . This earns B1 if stated correctly or derived.
- Use the point to find the intercept: Line has the form . It passes through . Substituting these values gives . Calculating yields . So, . Solving for gives . This substitution step earns M1.
- Write the final equation: Combining the gradient and intercept gives .
Key Takeaways
- The condition for perpendicularity is . This means you flip the fraction and change the sign.
- Once you have the gradient, any single point on the line is sufficient to find the exact equation.
Common Mistakes
- Taking the wrong negative reciprocal (e.g., keeping the sign same or flipping without changing sign).
- Arithmetic errors when calculating . Remember to simplify before multiplying.
- Errors in solving for : , not .
- Writing the equation in a different form (e.g., ) without converting to if that format is expected, although is mathematically equivalent. The mark scheme accepts 'oe' but standard form is safest.
Things to Be Careful About
- Ensure you use the gradient from your answer in part (a). If you made an error in (a), you might still get marks for method in (b) if you use your own incorrect gradient consistently ('follow-through'), but the final answer would be based on that error. In this case, using the correct gradient leads to .
- The question does not specify the form of the final answer, but is standard for such questions.
The diagram shows the speed–time graph for a cyclist's journey.
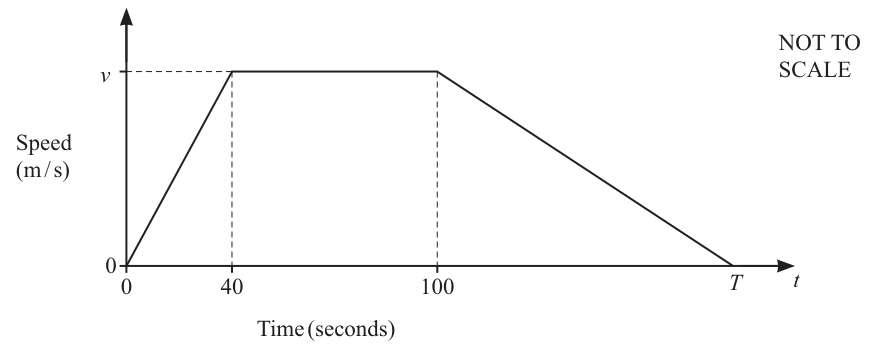
Approach
On a speed-time graph, the vertical axis represents speed. A horizontal line indicates that the speed is not changing over time.
Working
Between and , the graph is a horizontal line at speed . This means the speed is not increasing or decreasing.
Answer
The cyclist is travelling at a constant speed.
Constant speed
Walkthrough
The vertical axis of the graph shows speed. When the line is horizontal, the y-value (speed) remains the same for all x-values (time) in that interval. Therefore, the cyclist is moving at a constant speed.
Key Takeaways
- A horizontal line on a speed-time graph represents constant speed.
- A sloping line represents constant acceleration (if straight) or changing acceleration (if curved).
Common Mistakes
- Describing the motion as 'constant acceleration' when the line is horizontal. Remember, acceleration is the gradient; a horizontal line has a gradient of zero.
- Saying 'stationary' — that would be a horizontal line on the time axis (speed = 0).
Things to Be Careful About
- Use precise terminology: 'constant speed' is the correct description. 'Uniform velocity' is also acceptable if direction is assumed straight, but 'constant speed' is safer and matches the mark scheme.
- The mark scheme accepts 'oe' (or equivalent), so 'constant velocity' or 'steady speed' would also score.
Approach
Acceleration is defined as the rate of change of speed. On a speed-time graph, this is the gradient of the line. For a straight line, gradient .
Working
The cyclist accelerates from to . The speed increases from to .
Given that the acceleration is :
Multiply both sides by :
Answer
is shown.
v = 10
Walkthrough
Acceleration is the gradient of the speed-time graph. Between and , the graph is a straight line from to . The gradient is . Setting this equal to the given acceleration of and solving for gives .
Key Takeaways
- Acceleration is the gradient of a speed-time graph.
- For a straight line, gradient .
Common Mistakes
- Using the wrong formula for acceleration, such as .
- Forgetting that the initial speed is at .
Things to Be Careful About
- The mark scheme requires showing the working . Simply writing without method will not score the mark.
- Units: acceleration is in , time is in seconds, so speed is in . No unit conversion is needed here.
The total distance travelled by the cyclist between and is .
Find the value of .
= ______
Approach
The total distance travelled is the area under the speed-time graph. The graph forms a trapezium with parallel sides along the time axis. We must first convert the total distance to metres to match the speed units, then equate the area of the trapezium to this distance and solve for .
Working
Convert the total distance to metres:
The area under the graph is a trapezium with:
- Parallel sides: (the total time) and (the time at constant speed).
- Height: (from part (b)).
The formula for the area of a trapezium is:
Substitute the known values:
Simplify the right side:
Divide both sides by :
Solve for :
Answer
220
Walkthrough
Distance is the area under a speed-time graph. The total distance is given as , which must be converted to to be consistent with the speed in . The shape under the graph is a trapezium. The parallel sides are the total duration and the duration of constant speed . The height is the constant speed . Using the trapezium area formula , we set . Solving this linear equation gives .
Key Takeaways
- Distance travelled area under a speed-time graph.
- The area can be split into simpler shapes (triangle, rectangle, trapezium) or calculated directly using the trapezium formula if the graph forms one.
- Always check unit consistency (km vs m, hours vs seconds) before equating areas to distances.
Common Mistakes
- Forgetting to convert to , leading to an incorrect equation like .
- Misidentifying the parallel sides of the trapezium. The parallel sides are horizontal: the total time and the constant-speed time . The height is the vertical speed .
- Calculating the area as a rectangle plus two triangles and making an arithmetic error.
Things to Be Careful About
- The mark scheme awards method marks for a correct method to find a relevant area under the graph, or specifically for the equation .
- Final answer must be a number; is correct. If units were required, it would be seconds, but the question asks for the value of .
- Ensure the equation is solved correctly: . Do not stop at .
Simplify.
______
Approach
To simplify the rational expression, we must factorise both the numerator and the denominator completely. Once in factored form, any common factors can be cancelled.
Working
Step 1: Factorise the numerator.
The numerator is . First, identify a common numerical factor of 3:
The expression inside the bracket, , is a difference of two squares ():
So, the fully factored numerator is:
Step 2: Factorise the denominator.
The denominator is . We look for two numbers that multiply to give and add to give . These numbers are 7 and 4.
Split the middle term using these numbers:
Group the terms:
Factorise each group:
Extract the common bracket :
Step 3: Cancel common factors.
Substitute the factored forms back into the fraction:
The term appears in both the numerator and the denominator, so it cancels out (assuming ):
This can also be written as .
Answer
3(x-2)/(2x+7)
Walkthrough
The question asks us to simplify a fraction containing polynomials. The key strategy here is factorisation. If we can write the top and bottom as products of simpler brackets, we can remove anything that appears on both sides.
First, look at the top part (numerator): . Both terms share a factor of 3. Pulling that out leaves . This is a classic 'difference of two squares' because is a square and 4 is a square. It splits into .
Next, look at the bottom part (denominator): . This is a quadratic with a leading coefficient greater than 1. A reliable method is to find two numbers that multiply to and add to 11. Those numbers are 7 and 4. We rewrite as , then group terms to find the common factor . This results in .
Now the fraction is:
We see is on the top and bottom. We cancel it. What remains is .
Key Takeaways
- Always check for a common numerical factor before attempting complex quadratic factorisation.
- Recognise the 'difference of two squares' pattern ().
- For quadratics where the first term has a coefficient (like ), finding factor pairs of helps split the middle term correctly.
Common Mistakes
- Incorrect factorisation of the numerator: Students might write but forget to expand the difference of squares further, losing marks for incomplete simplification.
- Wrong sign in difference of squares: Writing or instead of .
- Factoring errors in the denominator: Choosing number pairs that multiply to 28 but don't sum to 11 (e.g., 2 and 14). Or failing to distribute the leading coefficient correctly during grouping (e.g., writing which expands to ).
- Leaving uncancelled factors: Failing to spot that is present in both parts.
- Expanding the final answer: While is correct, usually the factored form is preferred unless specified otherwise, though both are accepted per the mark scheme.
Things to Be Careful About
- Ensure you have found the greatest common factor in the numerator. Missing the 3 would lead to an incorrect denominator match later.
- When splitting the middle term in the denominator, verify your result by expanding to ensure it equals .
Work out.
Give your answer as a fraction in its simplest form.
______
Approach
Write the recurring decimal as a fraction, then add using a common denominator.
Working
Let
Since the repeating block has 2 digits, multiply by :
Subtract from :
Now add :
Simplify by dividing the numerator and denominator by :
Answer
8/11
Walkthrough
The decimal means , where the block repeats forever. To change this into a fraction, set and multiply by because the repeating block has two digits:
Subtracting the original equation removes the recurring tail:
so
Next, write with denominator :
Add the two fractions:
Finally simplify by dividing top and bottom by :
Key Takeaways
A recurring decimal can be converted to a fraction by choosing the power of that matches the length of the repeating block, multiplying, and subtracting. Then use a common denominator to add fractions, and always reduce the final result.
Common Mistakes
- Multiplying by instead of when the repeating block has two digits; this does not line up the recurring tails.
- Leaving the answer as because the question asks for simplest form.
- Misreading the recurring notation and using the wrong decimal; here the repeating block is .
- Adding without a common denominator, which would give an invalid fraction.
Things to Be Careful About
Show your working: seeing earns partial credit, and the common-denominator step earns a method mark. On this non-calculator paper, present all fraction arithmetic by hand. The answer must be exact and in simplest form: .
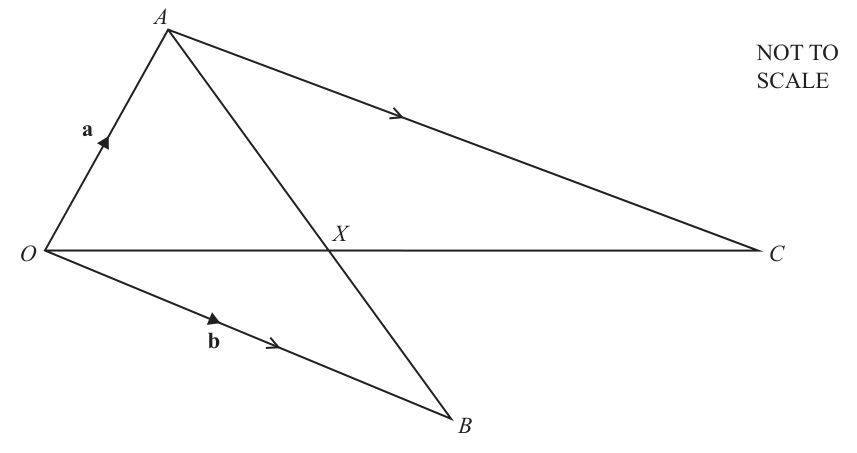
and .
is a point on where .
is a straight line.
is parallel to .
Approach
To find , first express in terms of and using the triangle law of vector addition. Then, use the given ratio to find as a fraction of .
Working
By the triangle law of vector addition:
Since lies on and , the point divides in the ratio . This means is of .
Answer
3/5 b - 3/5 a
Walkthrough
We are given the position vectors and . To find , we first need . Using the triangle law, . The point is on such that . This means the total length is split into equal parts, and takes up of those parts. Therefore, . Substituting the expression for gives , which simplifies to .
Key Takeaways
- The vector between two points can be found by subtracting their position vectors: .
- If a point divides a line segment in a ratio , the vector from the first point to the dividing point is of the total vector.
Common Mistakes
- Writing (reversing the order).
- Forgetting to add the ratio parts together: using instead of .
- Not expanding the bracket to give the answer in the simplest form .
Things to Be Careful About
- Ensure the final answer is written in terms of and as requested.
- The ratio means is the -part share out of total parts, not of .
- Keep vectors bold or use arrow notation consistently as required by the question.
Approach
To find , we can use the fact that is a straight line and is parallel to . This creates two similar triangles, and . We first find using vector addition, then use the similarity ratio to find .
Working
First, find :
Since is parallel to and is a straight line, and are similar. We can verify this:
- (vertically opposite angles)
- (alternate angles, since and is a transversal)
The ratio of similarity is determined by the known sides and :
Therefore, the corresponding sides and are in the same ratio:
Substitute :
Answer
3/5 a + 9/10 b
Walkthrough
We need . Since is a straight line, is a scalar multiple of . To find this scalar, we use the parallel condition: . This makes and similar (AA similarity: vertically opposite angles at , and alternate angles at and ). The ratio of similarity is . Thus, , meaning . We already know and from part (a), . Adding these gives . Multiplying by yields .
Key Takeaways
- Parallel lines in a vector diagram often create similar triangles, allowing you to find scalar relationships between vectors.
- Vector addition along a path () is a fundamental tool for finding position vectors of intermediate points.
- Vertically opposite angles and alternate angles are key to proving triangle similarity in these problems.
Common Mistakes
- Assuming directly without using the similar triangles correctly.
- Forgetting that and are in the same direction (since is a straight line), so the scalar is positive.
- Arithmetic errors when multiplying fractions, e.g., , not .
Things to Be Careful About
- The mark scheme accepts alternative routes, such as finding first (from similarity) and then using . Both routes are valid.
- Ensure the final answer is simplified and written in terms of and .
- Check that the direction of matches ; if you get a negative scalar, you may have the order of similarity reversed.
Approach
Complete the square for by halving the coefficient of , squaring it, and subtracting the result to keep the expression equivalent.
Working
Answer
(x + 2)^2 - 16
Walkthrough
To complete the square for , we take half of the coefficient of , which is . This gives the binomial . Expanding gives . To make this equal to the original expression , we must subtract because . Thus, the expression becomes .
Key Takeaways
Completing the square rewrites a quadratic as . This form immediately reveals the turning point of the parabola.
Common Mistakes
Forgetting to subtract the square of the halved coefficient (i.e., writing instead of ). Expanding incorrectly as or .
Things to Be Careful About
The final answer must be in the exact form . Ensure the constant term is correctly adjusted: .
Use your answer to part (a) to find the coordinates of the turning point of the graph of .
( ______ , ______ )
Approach
For a quadratic in the form , the turning point (minimum or maximum) is at . Since the coefficient of is positive, this is a minimum.
Working
From part (a), we have:
Here, and . The turning point is:
Answer
(-2, -16)
Walkthrough
The completed square form represents a parabola shifted units left and units up from the origin. The vertex (turning point) is simply . In our expression , and , so the turning point is .
Key Takeaways
The completed square form directly provides the coordinates of the turning point without needing to differentiate or use the formula .
Common Mistakes
Sign errors when reading the turning point, such as writing instead of because the form is , meaning the x-coordinate is .
Things to Be Careful About
Follow-through marks are awarded if the student uses their own (incorrect) values from part (a). For example, if they wrote , they would get the turning point .
Approach
To sketch the graph, find the intercepts with the axes. The y-intercept is found by setting . The x-intercepts are found by setting and solving the quadratic equation. Then draw a U-shaped curve (parabola) passing through these points with the turning point at .
Working
y-intercept:
Set :
The graph crosses the y-axis at .
x-intercepts:
Set :
Factorise the quadratic:
So or . The graph crosses the x-axis at and .
Alternatively, using the answer from part (a):
Sketch:
Draw a U-shaped curve opening upwards. Mark the x-intercepts at and , and the y-intercept at . The minimum point is at , which is in the third quadrant.
Answer
The graph crosses the axes at , , and .
Graph crossing axes at (-6, 0), (2, 0), and (0, -12)
Walkthrough
First, find where the graph crosses the y-axis by substituting into the equation, giving . Next, find where it crosses the x-axis by setting and solving . This factors to , giving and . With the intercepts and the turning point known, draw a smooth U-shaped curve passing through all these points.
Key Takeaways
Sketching a quadratic graph requires identifying the y-intercept, x-intercepts, and the turning point. The completed square form is especially useful for finding the turning point and x-intercepts.
Common Mistakes
Forgetting to label the intercepts on the sketch. Drawing the curve opening downwards instead of upwards (since the coefficient of is positive). Placing the turning point in the wrong quadrant.
Things to Be Careful About
The sketch must be a smooth curve, not straight lines. The turning point must be in the correct position relative to the intercepts. If the sketch is incorrect, a maximum of 3 marks can be awarded even if the intercepts are calculated correctly.
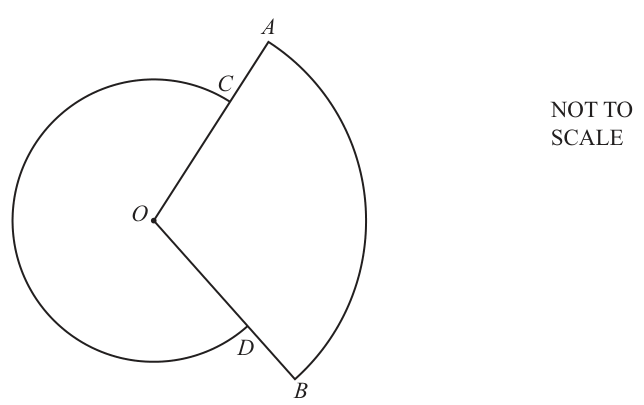
is a minor sector of a circle, centre .
is a major sector of a different circle, centre .
and are straight lines.
and .
The length of the minor arc is .
Work out the area of the major sector .
Give your answer in terms of .
______
Approach
First, use the arc length formula for minor sector to determine the sector angle . Then, calculate the reflex angle for the major sector by subtracting from . Finally, use the sector area formula with radius and the reflex angle to find the area in terms of .
Working
Let be the angle of the minor sector .
The arc length of minor sector with radius is given by:
Substitute the known values:
Simplify the left-hand side:
Divide both sides by :
The sector is a major sector with radius . Its angle is the reflex angle at :
Now, calculate the area of the major sector :
Answer
26pi
Walkthrough
-
Find the angle of the minor sector ():
We are given the radius of the larger circle and the length of the minor arc . The formula for arc length is:Setting up the equation:
Simplifying gives . Thus, , which gives .
-
Find the angle of the major sector :
Since and are straight lines, the minor angle is equal to . The sector is described as the major sector, so its angle is the reflex angle around centre : -
Calculate the area of the major sector:
The radius of sector is . Using the area of a sector formula:Since , the in the numerator cancels neatly with the denominator of , leaving:
Key Takeaways
- The formula for arc length is .
- The formula for the area of a sector is .
- A major sector corresponds to the reflex angle subtended at the centre, which is .
Common Mistakes
- Finding the area of the minor sector (using instead of ), which would give .
- Mixing up the radii: using for the area of instead of , or for the arc length of .
- Using the area formula when working with arc length instead of the circumference formula .
- Evaluating as a decimal (e.g. ) instead of keeping the answer in exact form in terms of as explicitly instructed.
Things to Be Careful About
- Ensure all calculations are done without a calculator, looking for common factors to simplify arithmetic by hand.
- The final answer must be left in terms of .