Mathematics (Syllabus D) 4024/21 — May/June 2020
Cambridge O-Level · Calculator · worked solutions for every part, with the mark scheme
Topics Algebra and Graphs · Number · Mensuration · Trigonometry · Geometry · Statistics · +2 more
The speeds, , of 80 vehicles travelling along a road were recorded.
The results are shown in the table.
| Speed () | Frequency |
|---|---|
| 10 | |
| 18 | |
| 27 | |
| 19 | |
| 6 |
Calculate an estimate of the mean speed of the vehicles.
______
Approach
For grouped data, estimate the mean by using the midpoint of each class interval as the representative value, multiplying by the frequency, summing, and dividing by the total frequency.
Working
The midpoints of the class intervals are:
| Speed (km/h) | Midpoint () | Frequency () | |
|---|---|---|---|
The total frequency is:
The estimated mean speed is:
Answer
54.1
Walkthrough
When data is given in class intervals rather than individual values, we cannot find the exact mean. Instead, we estimate it by assuming every value in a class is equal to the midpoint of that class. The midpoint of is , and similarly for the other classes. Multiplying each midpoint by its frequency gives an estimated total for that class. Adding all these gives , and dividing by the total number of vehicles () gives the estimated mean speed of km/h. The mark scheme accepts answers rounded to 1 or 3 significant figures: , , or .
Key Takeaways
- For grouped data, the estimated mean uses class midpoints.
- Always verify that the sum of frequencies equals the stated total before dividing.
- Roundings to 1 or 3 significant figures are accepted unless an exact form is required.
Common Mistakes
- Using the lower or upper class boundary instead of the midpoint.
- Forgetting to divide by the total frequency () and instead dividing by the number of classes ().
- Arithmetic errors in multiplying midpoints by frequencies or in summing.
- Not showing working ("nfww" means no follow-through without working shown).
Things to Be Careful About
- The mark scheme explicitly states "nfww" (no follow-through without working), so all steps must be shown.
- The answer is exact; , , and are all accepted rounded forms.
- Always double-check the sum of frequencies equals ; if it does not, the mean calculation is invalid.
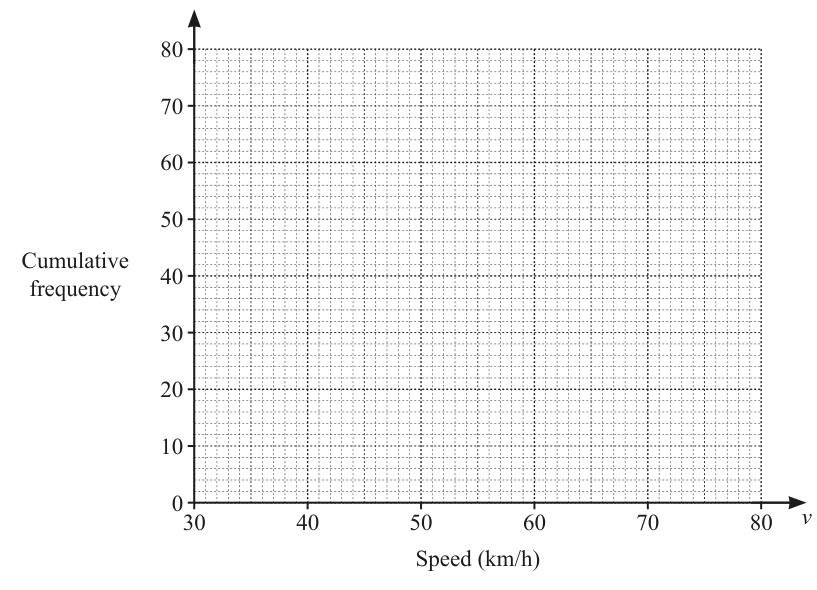
Draw the cumulative frequency diagram.
Approach
Cumulative frequency is found by adding each frequency to the running total. Plot the cumulative frequency against the upper class boundary of each interval, then join the points with a smooth curve (an ogive). The curve should start at the lower boundary of the first class with cumulative frequency .
Working
| Upper class boundary () | Frequency | Cumulative frequency |
|---|---|---|
Also include the starting point .
Answer
Plot the points , , , , , and draw a smooth S-shaped curve through them, starting at and ending at .
Points plotted: (30, 0), (40, 10), (50, 28), (60, 55), (70, 74), (80, 80) with a smooth S-curve through them
Walkthrough
Cumulative frequency at a given upper boundary is the total number of vehicles with speed less than or equal to that boundary. Starting from the first class with frequency , the cumulative frequency at is . Adding the next frequency gives at . Continuing: at ; at ; at . We also include as the starting point since no vehicles have speed less than km/h. Plot these six points on the grid in Fig. 1 and join them with a smooth curve. The curve should be S-shaped (ogive), rising slowly at first, then steeply in the middle, then flattening out as it approaches the total frequency of .
Key Takeaways
- Cumulative frequency is a running total of frequencies.
- Plot cumulative frequency against the upper class boundary, not the midpoint.
- Always include the starting point at the lower boundary of the first class with cumulative frequency .
- The curve must be smooth, not a series of straight line segments.
Common Mistakes
- Plotting against the midpoint of each class instead of the upper class boundary.
- Forgetting the starting point .
- Drawing straight lines between points instead of a smooth curve.
- Miscalculating the running total (e.g., instead of ).
- Not reaching a final cumulative frequency of at .
Things to Be Careful About
- The mark scheme awards B2 for 4 or 5 correct points plotted, or B1 for correct cumulative frequencies stated. All points should be accurate to within half a grid square.
- The curve must be smooth; jagged or angular curves may lose marks.
- Axes are already labelled in Fig. 1; do not relabel them.
Use your cumulative frequency diagram to find an estimate for
the median,
______
Approach
The median is the value at the position in the ordered data. For , the median position is . Draw a horizontal line from cumulative frequency to the curve, then drop a vertical line to the speed axis to read the median.
Working
Median position .
From the cumulative frequency diagram, at cumulative frequency , the corresponding speed is approximately km/h.
Answer
54
Walkthrough
The median divides the data into two equal halves. With vehicles, the median is the average of the th and st values, which we approximate by reading the value at cumulative frequency from the diagram. On the cumulative frequency curve, locate on the vertical axis, draw a horizontal line to the curve, then draw a vertical line down to the horizontal axis. The reading is approximately km/h. The mark scheme accepts any value from to km/h, allowing for normal reading error from a hand-drawn diagram.
Key Takeaways
- The median position for values is .
- Reading from a cumulative frequency diagram involves horizontal then vertical lines from the position to the curve to the axis.
- Allow for reading error; the mark scheme gives a tolerance range.
Common Mistakes
- Using the wrong position (e.g., for the median instead of ).
- Reading the cumulative frequency value instead of the speed value from the horizontal axis.
- Drawing horizontal/vertical lines in the wrong direction.
- Not allowing for reading error from a hand-drawn curve.
Things to Be Careful About
- The answer is read from the student's own diagram in part (b), so follow-through marks are awarded based on their diagram.
- The mark scheme accepts to km/h, reflecting normal reading tolerance.
- Always read the correct axis: speed is on the horizontal axis, cumulative frequency on the vertical.
the interquartile range.
______
Approach
The lower quartile (LQ) is at the position and the upper quartile (UQ) is at the position. Read both values from the cumulative frequency diagram and subtract: .
Working
Lower quartile position .
From the cumulative frequency diagram, at cumulative frequency , the corresponding speed is approximately km/h.
Upper quartile position .
From the cumulative frequency diagram, at cumulative frequency , the corresponding speed is approximately km/h.
Answer
17
Walkthrough
The interquartile range (IQR) measures the spread of the middle of the data. It is calculated as . For :
- Lower quartile position: . Reading from the diagram at cumulative frequency , the speed is approximately km/h (between where CF = and where CF = ).
- Upper quartile position: . Reading from the diagram at cumulative frequency , the speed is approximately km/h (between where CF = and where CF = ).
The IQR is km/h. The mark scheme accepts any answer from to km/h, allowing for reading error from the hand-drawn diagram. One mark is awarded for correctly identifying LQ (45 to 47) or UQ (61 to 63), and the second mark for the correct IQR calculation.
Key Takeaways
- Lower quartile is at position , upper quartile at .
- IQR = UQ - LQ; always subtract the smaller from the larger.
- Reading from a cumulative frequency diagram requires careful horizontal and vertical line construction.
- Allow for reading tolerance; the mark scheme gives a range.
Common Mistakes
- Using the wrong positions (e.g., for both quartiles).
- Subtracting in the wrong order (LQ - UQ gives a negative value).
- Reading the cumulative frequency value instead of the speed value.
- Not allowing for reading error from a hand-drawn curve.
- Forgetting that the mark scheme awards partial credit for correct quartile readings.
Things to Be Careful About
- The answer is read from the student's own diagram in part (b), so follow-through marks are awarded based on their diagram.
- The mark scheme accepts IQR from to km/h, reflecting normal reading tolerance.
- One mark is given for a correct LQ (45 to 47) or UQ (61 to 63), even if the other is wrong.
- Always show the subtraction: IQR = UQ - LQ.
The rest of this paper
9 more questions- Q2Transformations and Vectors7M
- Q3Algebra and Graphs8M
- Q4Number9M
- Q5Trigonometry · Mensuration · Number14M
- Q6Algebra and Graphs12M
- Q7Geometry · Algebra and Graphs9M
- Q8Mensuration · Geometry7M
- Q9Probability · Algebra and Graphs · Number12M
- Q10Trigonometry · Mensuration13M