Mathematics (Syllabus D) 4024/21 — October/November 2018
Cambridge O-Level · Calculator · worked solutions for every part, with the mark scheme
Topics Number · Algebra and Graphs · Trigonometry · Probability · Geometry · Coordinate Geometry · +3 more
The table shows the distances 10 people drive to work and the times they take.
| Distance (km) | 12 | 32 | 18 | 54 | 26 | 36 | 29 | 15 | 20 | 42 |
|---|---|---|---|---|---|---|---|---|---|---|
| Time (minutes) | 20 | 40 | 25 | 62 | 35 | 34 | 32 | 18 | 32 | 50 |
On the grid, complete the scatter diagram to show this information.
The first four points have been plotted for you.
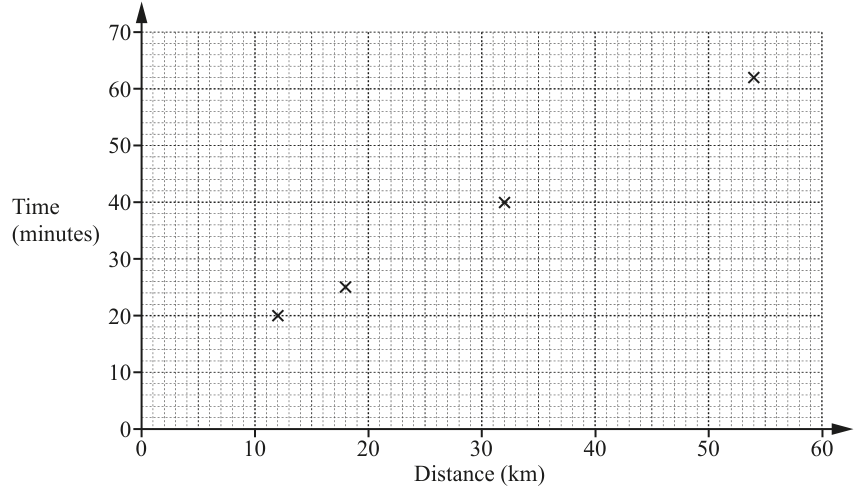
What type of correlation does the scatter diagram show?
______
One of these 10 people is selected at random.
Find the probability that this person drove less than to work.
Give your answer as a fraction in its simplest form.
______
Ateeq drives to work.
By drawing a line of best fit on the scatter diagram, estimate the time Ateeq takes to travel to work.
______
The table summarises the times taken by the 120 employees in a company to travel to work.
| Time ( minutes) | |||||
|---|---|---|---|---|---|
| Frequency | 29 | 38 | 26 | 21 | 6 |
Write down the modal class.
______
Calculate an estimate of the mean time.
______
Work out the percentage of employees who took more than 1 hour to travel to work.
______ %
The rest of this paper
10 more questions- Q2Number10M
- Q3Trigonometry · Number7M
- Q4Number · Probability8M
- Q5Algebra and Graphs9M
- Q6Geometry · Trigonometry9M
- Q7Transformations and Vectors · Coordinate Geometry9M
- Q8Algebra and Graphs6M
- Q9Mensuration · Geometry · Number12M
- Q10Mensuration · Algebra and Graphs · Trigonometry · Coordinate Geometry11M
- Q11Algebra and Graphs6M