Rate of reaction, collision theory, and concentration and pressure
“
explain and use the term rate of reaction, frequency of collisions, effective collisions and non-effective collisions … explain qualitatively, in terms of frequency of effective collisions, the effect of concentration and pressure changes on the rate of a reaction … use experimental data to calculate the rate of a reaction.
What "rate of reaction" means
The rate of reaction is the change in the amount (or concentration) of a reactant or product per unit time — how quickly reactants are used up, or products are formed:
You can follow a reaction by measuring anything that changes as it goes: the mass lost, the volume of gas collected, or a concentration found by titration or with a colorimeter. The rate then has the unit of what you measured divided by the unit of time: for a concentration, for a gas volume, and so on. The calculation is always the same: a change, divided by the time it took.
What is measured | Suits a reaction that… | Typical unit |
|---|---|---|
Volume of gas produced | releases a gas | cm³ s⁻¹ |
Mass lost (open flask, on a balance) | releases a gas that can be allowed to escape | g s⁻¹ |
Concentration (by titration or colorimetry) | involves a species whose amount can be sampled or whose colour changes | mol dm⁻³ s⁻¹ |
All three are valid. Choose whichever is practical for the reaction. (A gas that reacts with or dissolves in the water of the mixture, such as SO₂, which reacts with water to form H₂SO₃, cannot be measured accurately by its volume.)
Which measurements can track a reaction's rate
Which changes can be used to measure the rates of chemical reactions?
1 the decrease in concentration of a reactant per unit time
2 the rate of appearance of a product
3 the increase in total volume of gas per unit time at constant pressure
A 1, 2 and 3 are correct
B 1 and 2 only are correct
C 2 and 3 only are correct
D 1 only is correct
Show full working
- 1
Statement 1 follows a reactant being used up per unit time — the definition of rate. Correct.
- 2
Statement 2 follows a product being formed — the same definition, from the product side. Correct.
Rate can be followed from either side of the equation.
- 3
Statement 3 follows the gas volume produced per unit time at constant pressure — the gas-volume method in the table above. Correct.
"At constant pressure" matters: then the volume increase is due only to gas being made.
A (1, 2 and 3)
Rate can be followed through any quantity that changes as the reaction goes: a reactant falling, a product rising, a gas volume, a mass, a colour.
Calculating an average rate from data
An average rate covers a stretch of time. Take the reading at the start and at the end of that stretch, find the change, and divide by the time between them. The skill is picking the right two readings and getting the units right.
Average rate from two readings
Marble chips react with hydrochloric acid. The volume of collected is after and after . Calculate the average rate of reaction between and , with units.
Show full working
- 1
State the relationship:
Writing the relationship first tells you exactly which two quantities to find.
- 2
Change in volume: .
Use the two readings that bound the stretch asked for — not the reading at 80 s on its own, which would be the change since t = 0.
- 3
Time taken: .
- 4
Divide:
- 5
Units: volume unit over time unit, . So the average rate is .
The unit is part of the answer and often carries its own mark.
0.60 cm³ s⁻¹
Average rate from a concentration-time graph, with units
Aqueous bromine reacts with methanoic acid to form hydrogen bromide and carbon dioxide gas.
This reaction can be followed by measuring the concentration of bromine present in the mixture at regular time intervals. The graph shows the change in concentration of bromine against time in a reaction carried out at .
Use the graph to calculate the average rate of reaction at during the first . State the units of this rate of reaction.
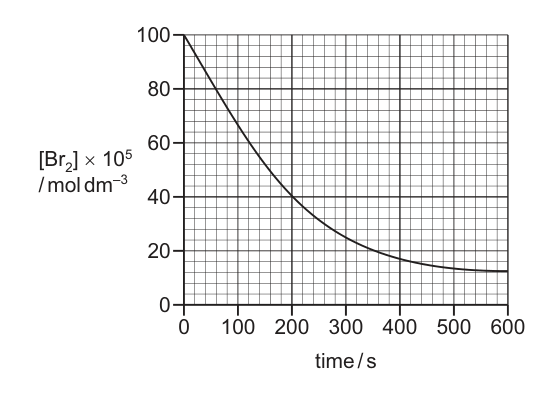
Fig. 4.1 as printed with the question.
Show full working
- 1
State the relationship:
- 2
Read the two values off Fig. 4.1: at , ; at , .
The axis is labelled [Br₂] × 10⁵, so a reading of 100 means [Br₂] = 100 × 10⁻⁵ mol dm⁻³. Dropping this factor is the usual error.
- 3
Change in concentration:
- 4
Divide by the time taken, :
- 5
Units: concentration () over time (), giving .
The unit is a separate mark on the mark scheme — a correct number with no unit scores only one of the two marks.
rate = 1.47 × 10⁻⁶ mol dm⁻³ s⁻¹
An average rate is the total change ÷ total time between the two readings. It does not mean the rate was constant in between — it usually was not.
Converting gas volume to a rate, via moles and stoichiometry
An aqueous solution of hydrogen peroxide is placed in a flask and decomposes, as shown.
The total volume of oxygen gas evolved is after 90 seconds, measured under room conditions.
The rate of the reaction is calculated using the equation shown.
What is the average rate of the reaction, measured in , over the duration of the experiment?
A
B
C
D
Show full working
- 1
Convert the gas volume to moles of , using the molar gas volume at room conditions, :
Room conditions means r.t.p., so 24 000 cm³ (24.0 dm³) per mole — the value on the Data Booklet.
- 2
Use the equation to find moles of used. The ratio is :
The rate is defined in terms of H₂O₂, but the data is about O₂. Two moles of H₂O₂ make one mole of O₂, so double it.
- 3
Convert the time to minutes, because the answer is wanted in :
- 4
Divide:
Each distractor is one missed step: A (8.33 × 10⁻⁵) forgets the 2 : 1 ratio and the minutes; B (1.67 × 10⁻⁴) divides by 90 s and stops, giving mol s⁻¹; C (0.0050) forgets the 2 : 1 ratio.
D (0.010 mol min⁻¹)
When a question gives "rate" in terms of one species but the data describes a different one, the stoichiometric ratio between them is not optional — check it before dividing by time, not after.
Reading how rate itself changes as a reaction proceeds
The rate of the reaction between a reactive metal and an excess of a dilute acid is investigated. The total volume of hydrogen gas produced is recorded every 30 seconds for 3 minutes.
| time / s | total volume of hydrogen gas / cm³ |
|---|---|
| 0 | 0 |
| 30 | 64 |
| 60 | 105 |
| 90 | 132 |
| 120 | 151 |
| 150 | 161 |
| 180 | 167 |
The average rate of reaction during the first 30 seconds is . The average rate of reaction during the last 30 seconds is . What is the value of ?
A
B
C
D
Show full working
- 1
Find , the rate over the first : the volume changes from to , so
Keep an extra figure here and round only at the end.
- 2
Find , the rate over the last (from to ): the volume changes from to , so
"Last 30 seconds" means 150 s to 180 s, not 0 to 180 s. Option C (2.13) is P on its own.
- 3
Subtract:
Q is less than a tenth of P: the rate falls as the reaction goes on, because the metal (the acid is in excess) is being used up. Collision theory, later in this section, explains why.
B (1.93 cm³ s⁻¹)
The average rate early in a reaction is almost always bigger than later on. Use exactly the two time points the question asks for.
Rate at one instant: the gradient of a tangent
On a graph of concentration (or volume) against time, the gradient of the line is the rate. A steep line means a fast reaction; a flat line means the reaction has stopped (gradient ).
The graph is usually a curve, because the rate keeps changing. To find the rate at one particular moment:
- draw a tangent — a straight line that just touches the curve at that time, with the same slope as the curve there;
- read two points on the tangent that are far apart (the axis intercepts are often easiest);
- gradient between those two points;
- rate the size of the gradient, with units. (For a falling reactant concentration the gradient is negative; the rate is given as a positive number.)
The rate at is called the initial rate. It is found the same way, with the tangent drawn at the very start of the curve.
Rate = gradient. The tangent at t = 0 is steep (fast); the tangent at t = 50 s is shallower (slower), because reactant has been used up.
Initial rate and rate at 50 s from tangents
The graph above shows the concentration of a reactant against time. The tangent at passes through and . The tangent at passes through and . (Concentration is in , time in .) Calculate the initial rate and the rate at .
Show full working
- 1
State the relationship:
- 2
Initial rate — change in concentration along the tangent at : .
Use two points on the tangent, not on the curve. The two points on the axes are the easiest to read accurately.
- 3
Change in time along the same tangent: .
- 4
Divide:
- 5
Rate at 50 s — change in concentration along the second tangent: .
Points far apart on the tangent keep the reading errors small compared with the changes you are dividing.
- 6
Change in time along the same tangent: .
- 7
Divide:
The rate at 50 s is less than half the initial rate: there is less reactant left, so the rate falls. The collision theory later in this section explains why.
Initial rate = 2.0 × 10⁻³ mol dm⁻³ s⁻¹; rate at 50 s = 7.4 × 10⁻⁴ mol dm⁻³ s⁻¹
Rate from a tangent, via a calibration curve
In acidic conditions, iodine reacts with propanone in a substitution reaction.
The kinetics of the reaction are investigated using a colorimeter. As the reacts, the yellow/brown colour of the fades to colourless, changing the absorbance of the solution.
Known concentrations of are used to prepare a calibration curve graph and the absorbance is then measured as the reaction proceeds.
What is the rate of reaction at ?
A
B
C
D
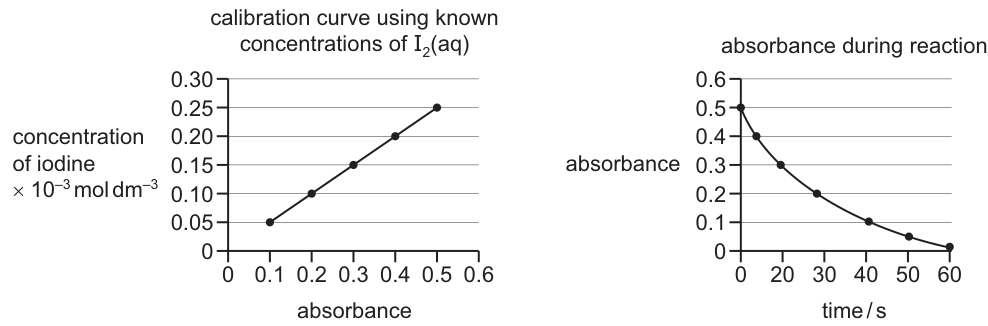
The two graphs as printed with the question.
Show full working
- 1
Draw a tangent to the absorbance–time curve at (where the absorbance is ).
"Rate at 20 s" is a rate at one instant, so it needs a tangent, not an average between two readings.
- 2
Find its gradient from two points far apart. The tangent falls by about absorbance units over about :
Hand-drawn tangents differ a little; anything from about 0.008 to 0.010 per second leads to the same option.
- 3
Read the conversion factor off the calibration curve. Absorbance matches , and the line passes through the origin (absorbance matches ), so
The rate must be in mol dm⁻³ s⁻¹, but the tangent gives absorbance per second. The calibration curve converts one into the other.
- 4
Convert the gradient into a rate:
Option B (1 × 10⁻⁵) is the trap: it takes the absorbance gradient (≈ 0.01) as if it were in 10⁻³ mol dm⁻³ and forgets the calibration factor of 0.5. C and D forget the 10⁻³ on the calibration axis.
A
Read every axis label: here the concentration axis is in units of 10⁻³ mol dm⁻³, and the rate is found in absorbance units until the calibration curve converts it.
Rate from the time taken: rate ∝ 1/time
Some experiments do not follow the whole reaction. Instead they time how long it takes to reach one fixed point — a cross under the flask disappearing behind a precipitate, or an indicator colour suddenly changing. Every run makes the same fixed amount of change, so
A shorter time means a faster rate. (unit ) is used as a measure of the rate, and runs are compared by comparing their values of .
Comparing rates from times
Sodium thiosulfate reacts with hydrochloric acid to form a sulfur precipitate. The time for a cross under the flask to disappear is at and at . Everything else is kept the same. How many times faster is the reaction at ?
Show full working
- 1
State the relationship: the same amount of sulfur hides the cross in each run, so .
This only works because every run stops at the same point (the same amount of product).
- 2
At : .
- 3
At : .
- 4
Compare: The reaction is 4 times faster at .
A common slip is to compare the times the wrong way up. The shorter time is the faster reaction, so the ratio is 80 ÷ 20, not 20 ÷ 80.
4 times faster (1/t rises from 0.0125 s⁻¹ to 0.0500 s⁻¹)
Collision theory: why particles have to meet before they can react
Why does a reaction go at the rate it does? For two particles to react they must first collide. But colliding is not enough. A collision has one of two outcomes:
- an effective collision (also called a successful collision) — the particles collide with enough energy and the right orientation, so they react (the minimum energy needed is called the activation energy, — see the next section);
- a non-effective collision — the particles bounce apart unchanged, because they had too little energy, the wrong orientation, or both.
The frequency of collisions is the number of collisions per second. In most reactions only a tiny fraction of collisions are effective. The rate depends on the frequency of effective collisions — the number of effective collisions per second — not on the total number of collisions.
Most collisions simply bounce particles apart unchanged (non-effective); only a collision with enough energy and the right orientation actually reacts (effective).
Concentration and pressure: changing how often particles meet
A higher concentration of a reactant in solution puts more particles in the same volume. A higher pressure of a gas does the same thing: it squeezes the gas particles into a smaller volume. Either way:
- there are more particles per unit volume;
- so the particles collide more often — a higher frequency of collisions;
- the fraction of collisions that are effective stays the same, so the frequency of effective collisions increases;
- so the rate increases.
Be clear about what concentration and pressure do not do. The particles do not gain energy and do not move faster (only temperature does that), and each collision is no more likely to succeed. There are simply more collisions every second.
The same idea explains surface area for a solid reactant. Powder or small lumps expose more particles on the surface than one big lump, so the other reactant collides with the solid more often.
The same volume holding more particles — a higher concentration, or a gas at higher pressure — has more collisions per second.
Explaining the effect of pressure on rate
Hydrogen and iodine react as gases: . The mixture is compressed to a higher pressure at constant temperature. Explain, in terms of collisions, why the rate increases.
Show full working
- 1
Link pressure to particles: at higher pressure the same number of gas molecules is in a smaller volume, so there are more molecules per unit volume.
Start from what physically changes. Pressure changes how crowded the particles are, not their energy.
- 2
Link that to collisions: the molecules are closer together, so and molecules collide more frequently.
- 3
Link that to effective collisions: the temperature is unchanged, so the same fraction of collisions have enough energy. More collisions per second therefore means more effective collisions per second.
Do not write "more molecules have energy above Eₐ" — that is the temperature answer, and it is wrong here.
- 4
Conclude: a higher frequency of effective collisions means a higher rate.
More molecules per unit volume → more frequent collisions → more frequent effective (successful) collisions → faster rate. The energy of the molecules is unchanged.
Pressure versus temperature: choose the right reason
Why does the rate of a gaseous reaction increase when the pressure is increased at a constant temperature?
A More particles have energy that exceeds the activation energy.
B The particles have more space in which to move.
C The particles move faster.
D There are more frequent collisions between particles.
Show full working
- 1
A is wrong. The temperature is constant, so the particles' energies are unchanged. "More particles with energy above the activation energy" is how temperature works.
Activation energy is defined in the next section; for now, note that particle energies depend only on temperature.
- 2
B is wrong. Higher pressure means the particles are squeezed into less space, not more.
- 3
C is wrong. Particle speed depends on temperature, which has not changed.
- 4
D is right. More particles per unit volume collide more often, so effective collisions are more frequent too.
D
Concentration and pressure → more frequent collisions. Temperature → more particles with enough energy (and slightly more frequent collisions).
Linking a concentration change to the frequency of effective collisions
In reaction 1, a student measures the initial rate of production of when is added to of .
In reaction 2, the student repeats the experiment using of and the same mass of .
In reaction 1 and reaction 2, the acid is in excess and samples of the same powder are used.
Which row is correct?
| A | greater than 1 | greater than 1 |
| B | greater than 1 | less than 1 |
| C | less than 1 | greater than 1 |
| D | less than 1 | less than 1 |
Show full working
- 1
Spot the one thing that changes. Same volume of acid, same mass of the same powder (so the same surface area), and no change of temperature is mentioned — only the acid concentration differs: in reaction 1 against in reaction 2.
- 2
Apply collision theory. Reaction 2 has five times as many ions in each , so acid particles strike the surface of the powder more often: the frequency of collisions, and with it the frequency of effective collisions, is higher in reaction 2. So the ratio (reaction 1 ÷ reaction 2) of effective collisions per second is less than 1.
- 3
Link collisions to rate. Rate depends on the frequency of effective collisions, so reaction 2 is also faster — the ratio of rates (reaction 1 ÷ reaction 2) is less than 1 as well.
Rate and effective-collision frequency must always move together — the rate IS the frequency of effective collisions, seen from the outside. Options B and C, where the two ratios point opposite ways, can be rejected on that alone, before any chemistry is looked at.
D (both ratios less than 1)
Watch which way a ratio is written: 'reaction 1 ÷ reaction 2' with reaction 2 the more concentrated gives values LESS than 1, even though the higher concentration is the faster reaction.
Your turn
- 1
of a solution has an initial iodine concentration of . After , titration shows the concentration has fallen to . Calculate the average rate of reaction in .
Stuck? Show hint
Convert the time to seconds before dividing — the concentration values are already in the units the answer needs.
Show solution
- 1
State the relationship: .
- 2
Change in concentration: .
The 25.0 cm³ volume is not needed: the rate is asked for in concentration units, and concentration already allows for the volume.
- 3
Convert time to seconds: .
The unit asked for is per second, so the minutes must go first.
- 4
Divide:
Answer5.83 × 10⁻⁵ mol dm⁻³ s⁻¹
- 1
- 2
In a clock reaction the blue colour appears after in run 1 and after in run 2. Calculate for each run and state how many times faster run 1 is.
Stuck? Show hint
Every run stops at the same point, so rate ∝ 1/t.
Show solution
- 1
Relationship: the same amount of change happens before the colour appears, so .
- 2
Run 1: .
- 3
Run 2: .
- 4
Compare: , so run 1 is 4 times faster.
The shorter time is the faster run. Check: 180 ÷ 45 = 4 gives the same answer directly.
Answer1/t = 0.0222 s⁻¹ (run 1) and 0.00556 s⁻¹ (run 2); run 1 is 4 times faster.
- 1
- 39701/23 M/J 2025 Q4(a)(i), (a)(iii)3 marks
The reaction between and is monitored at constant temperature.
Fig. 4.1 shows how the concentration of varies with time.
(i) Use Fig. 4.1 to find the average rate of change of concentration of in this reaction between 0–100 seconds and between 400–500 seconds. Include units in your answers.
(iii) Explain why the rate of reaction changes with time.
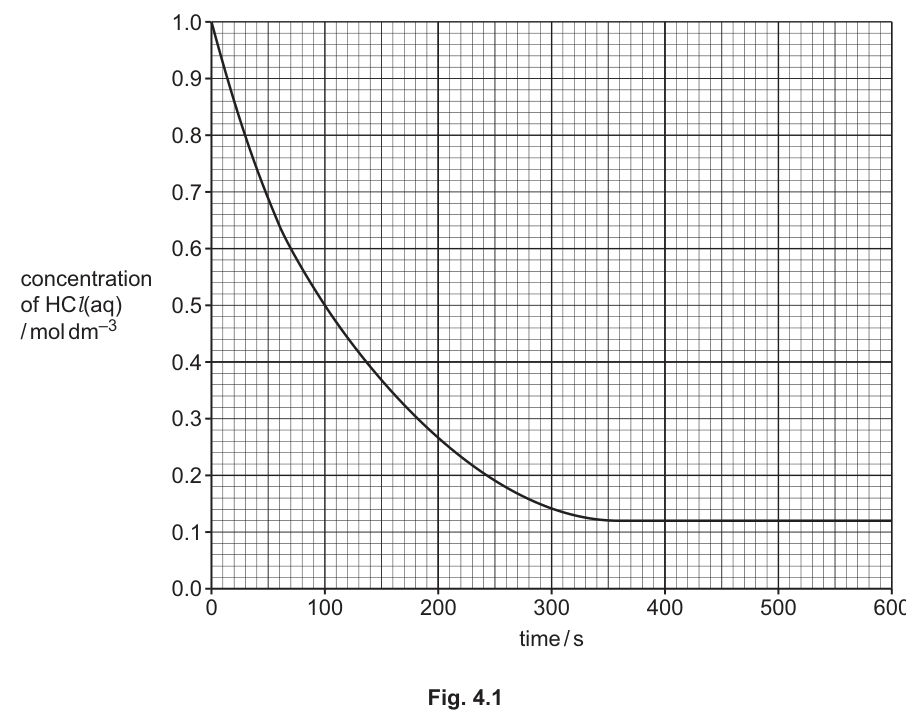
Fig. 4.1 as printed with the question.
Stuck? Show hint
For (i), read [HCl] at the two ends of each 100 s stretch. For (iii), use the words 'frequency of effective collisions'.
Show solution
- 1
(i) Relationship: .
- 2
0–100 s: falls from to , a change of in :
Because [HCl] is falling, −0.005 is also accepted; the mark scheme allows either sign.
- 3
400–500 s: the line is flat at , so the change is and the rate is .
The reaction has stopped: the flat line shows HCl is left over, so the other reactant has run out.
- 4
Units for both: .
Two of the three points (0.005, 0, units) score 1 mark; all three score 2.
- 5
(iii) As the reaction goes on, the concentrations of and decrease, so the frequency of effective collisions decreases and the rate falls.
The mark needs both the falling concentration and 'frequency of effective collisions'. 'Fewer collisions' alone is not enough.
Answer(i) 0–100 s: 0.005 mol dm⁻³ s⁻¹; 400–500 s: 0 mol dm⁻³ s⁻¹. (iii) The concentration of the reactants falls, so the frequency of effective collisions decreases.
- 1
- 49701/11 M/J 2023 Q111 mark
Iodine and propanone react according to the following equation.
If the concentration of propanone is increased, keeping the total reaction volume constant, the initial rate of the reaction also increases.
What could be the reason for this?
A A greater proportion of collisions are successful at the higher concentration.
B The particles are further apart at the higher concentration.
C The particles have more energy at the higher concentration.
D There are more collisions per second between particles at the higher concentration.Show solution
- 1
A higher concentration puts more particles in the same volume, so they are closer together — B is wrong.
- 2
Concentration does not change the energy of the particles — C is wrong.
- 3
The proportion of collisions that succeed depends on energy, which has not changed — A is wrong.
This is the trap: the NUMBER of successful collisions per second rises, but the PROPORTION does not.
- 4
More particles per unit volume → more collisions per second — D is right.
AnswerD
- 1
The rest of this note
Can you do all of these?
Define rate of reaction, and calculate an average rate from experimental data (gas volume, concentration, mass), with correct units, including converting between amount of one species and another via stoichiometry
Find the rate at one instant (and the initial rate) from the gradient of a tangent, using a calibration curve where needed
Use rate ∝ 1/time to compare runs timed to the same fixed point
Explain and use the terms frequency of collisions, effective collision and non-effective collision
Explain, in terms of frequency of effective collisions, why increasing concentration or pressure increases rate — without claiming the particles gain energy
State the definition of activation energy precisely: the minimum energy required for a collision to be effective
Sketch a Boltzmann distribution from blank axes, correctly labelled, with the right shape (origin start, single peak, non-zero tail)
Shade or identify the area on a Boltzmann distribution that represents particles with sufficient energy to react
Explain that the peak of a Boltzmann distribution is the most probable energy, not the mean
Sketch a second Boltzmann curve at a higher temperature: same origin, lower and right-shifted peak, crossing the original once only beyond the original peak, never touching the energy axis
Explain the effect of temperature on rate: a greater proportion of particles have energy ≥ Ea, so effective collisions are more frequent (and collisions slightly more frequent); Ea itself does not change
Distinguish homogeneous from heterogeneous catalysis by comparing the catalyst's phase with the reactants' phase
Construct and interpret a reaction pathway diagram showing a catalysed route alongside the uncatalysed one, with the same reactants, same products and same ΔH, but a lower Ea
Find the activation energy of the reverse reaction from a pathway diagram, or from Ea(forward) and ΔH
Recognise a catalyst in a reaction scheme as a species used in one step and regenerated in a later one
Explain a catalyst's effect using the Boltzmann distribution: mark the lower Ea to the left on the same, unchanged curve; more particles have energy ≥ Ea, so effective collisions are more frequent